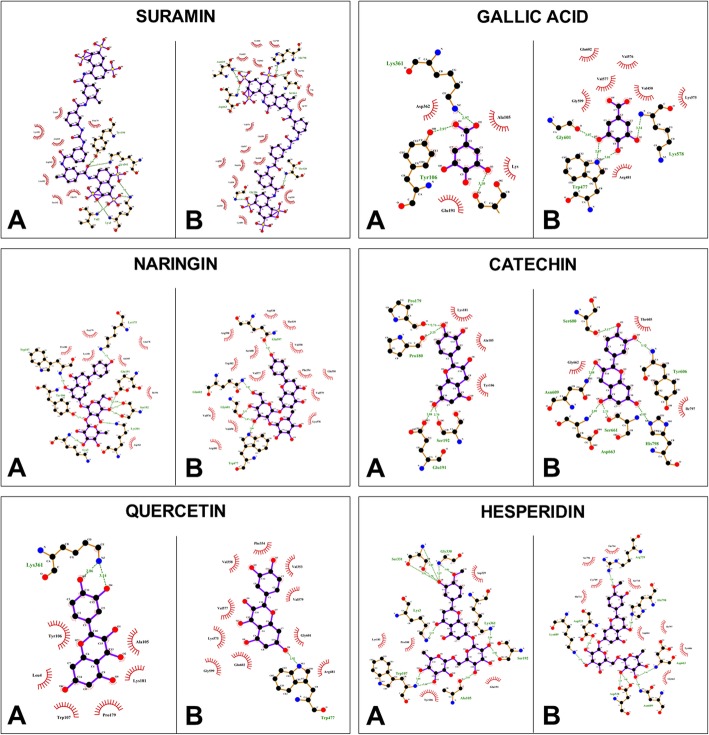
Fig. 6.
Protein interactions with the compounds isolated from the Pg-YP-I-22C fraction. a. Interactions of viral Protein E with the compounds. b. Interactions of viral Protein NS5 with the compounds. Hydrogen bond interactions are represented by dashed lines in green, and their distances are indicated (Å). Hydrophobic interactions are represented as red eyelashes. The names and numbers in the residues correspond to the target proteins. Images obtained using LigPlot+ v.1.4.5

