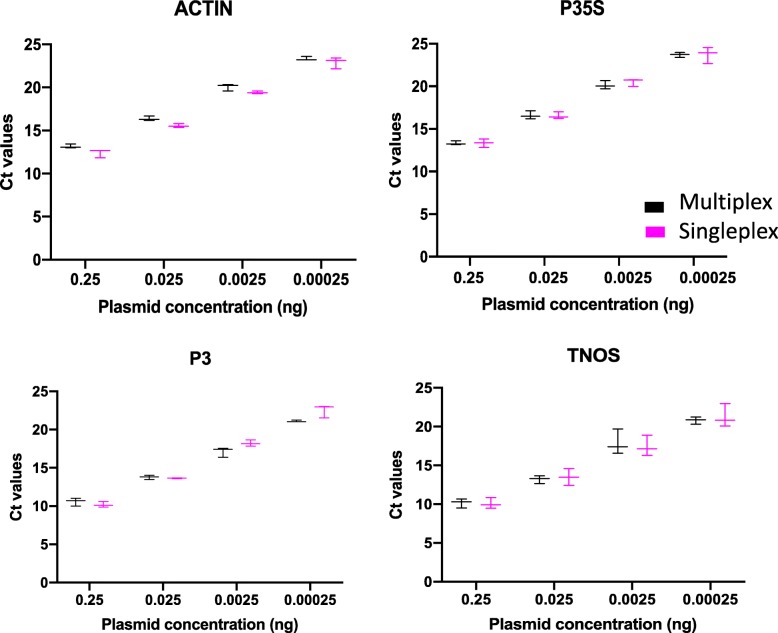
Fig. 2.
Multiplex to singleplex qPCR Ct comparison. Graphics showing the comparison of the Ct values for each target (actin, P35S, P3, and TNOS) obtained from the multiplex assay (in black) and from the singleplex assay (in pink). The error bars show results from three independent experiments. (N = 3, no significant differences between any pair of multiplex vs. singleplex Ct values for the same plasmid concentration and target, Student’s t test, P < 0.05)

