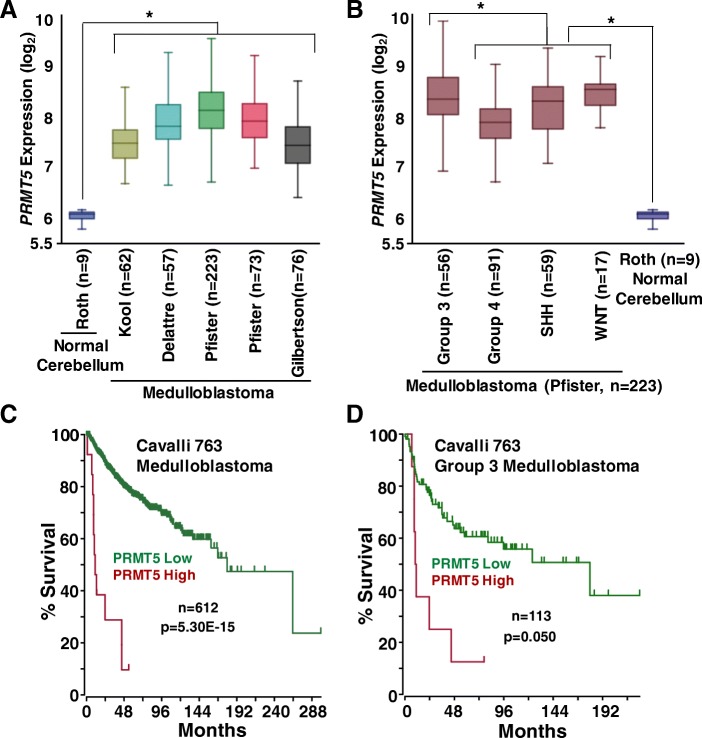
Fig. 1.
PRMT5 expression and correlation in primary medulloblastomas. a Boxplots showing PRMT5 expression in five non-overlapping cohorts (total n = 491) of medulloblastoma tumors compared to normal cerebellum (n = 9) controls. *Anova p < 0.05 vs. medulloblastoma. b PRMT5 expression in four (Group3, Group 4, SHH and WNT) medulloblastoma subgroups using Pfister (n = 223) cohort dataset. *Anova p < 0.05 vs. Group 3. Kaplan-Meier plots showing overall survival of patients (Cavalli 763 cohort) with medulloblastoma all subgroups (c) and Group 3 medulloblastoma (d) with respect to PRMT5 expression

