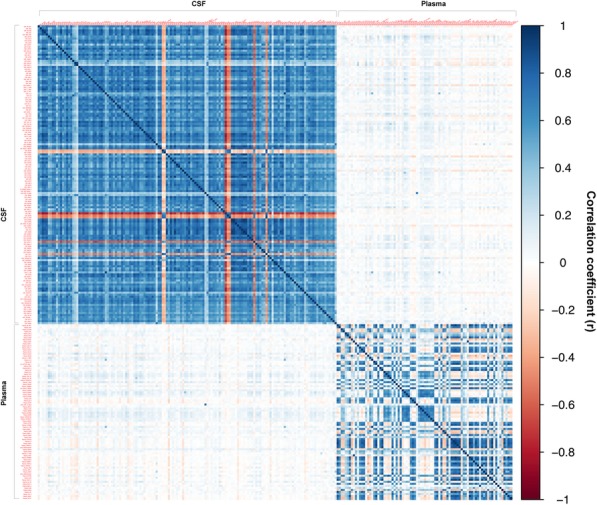
Fig. 3.

Between- and within-tissue correlation matrix, representing the strength of correlation (Pearson’s r) between proteins in plasma and cerebrospinal fluid (CSF). Positive correlations are illustrated in blue; negative correlations are illustrated in red. To reduce the dimensionality of the correlation matrix, only those proteins that were above the limit of detection, yielding Pearson’s r values equal to or greater than 0.7, were included. Image generated using the ggplot package in R
