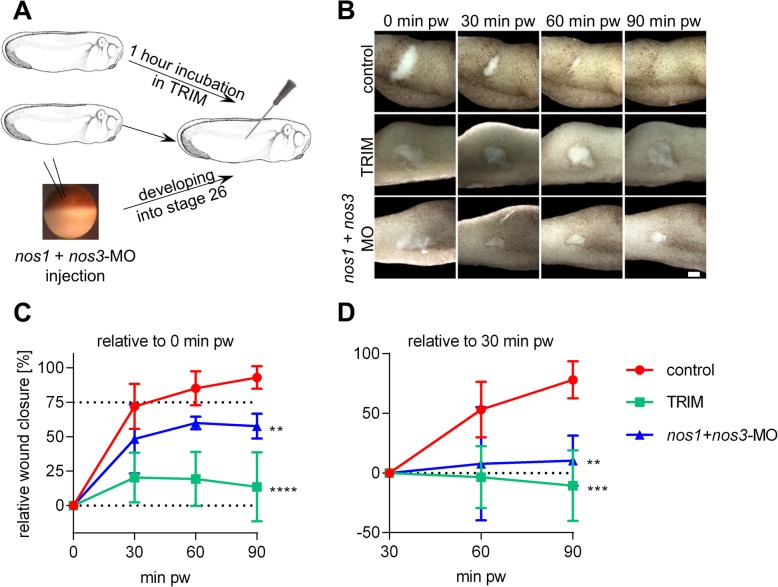
Fig. 2.
Monitoring of wound closing after inhibition of NO production. (a) Control embryos, embryos with inhibited production of NO using TRIM 1 hour before injury and embryos injected with the mixture of nos1 + nos3- MO were injured using a needle (stage 26). (b) Wound closing was documented using brightfield imaging on stereomicroscope (Scale bar = 100 μm). (c) Relative wound closure was calculated as ratio between the size of the wound in 0 minutes (d) or 30 minutes pw (at least three replicates per condition, mean with standard deviation, the statistical difference between the groups is derived from two linear mixed models). pw – post wounding **** - p < .0001, *** - p < .001, ** - p < .01

