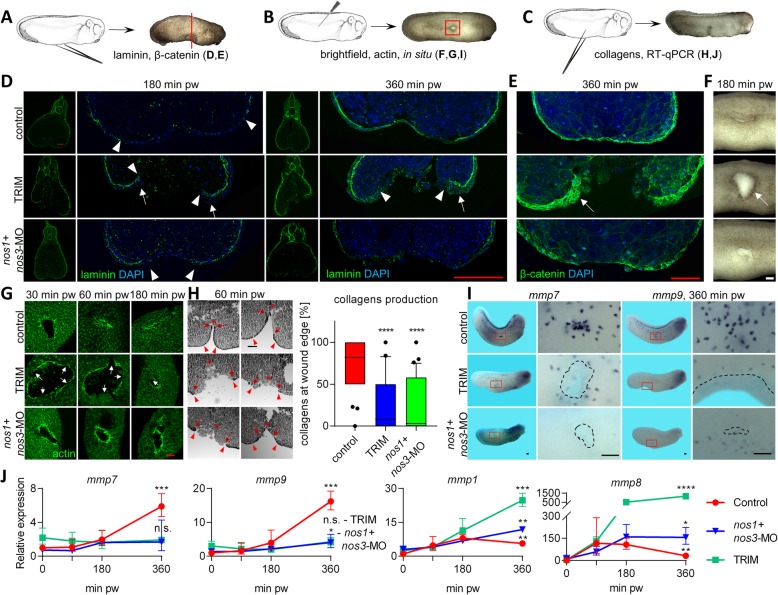
Fig. 5.
Monitoring of phenotype changes during wound healing in embryos with inhibited NO production. (a, b, c) Control embryos, embryos with inhibited production of NO using TRIM 1 hour before injury and embryos injected with mixture of nos1 + nos3- MO were injured at stage 26 using forceps or needle in the middle and ventral side. (d) Laminin layer was visualized at 180 minutes and 360 minutes pw and ends of the laminin layer are marked by a triangle. Formation of “blob” in TRIM embryos is marked by arrow (Scale bar = 100 μm). (e) Staining of β- catenin 360 minutes pw (Scale bar = 100 μm). (f) Brightfiled image of wound site in 180 minutes pw (Scale bar = 100 μm). (b, g) Actin at 30, 60 and 180 minutes pw visualized using green fluorescent phalloidin. Breaks in actin layer are marked by arrow (Scale bar = 100 μm). (c, h) Collagen staining at 60 minutes pw. The beginning of the wound is marked by a red triangle. A red arrow marks the end of the collagen layer, while the end of the wound site is marked by a red star. (Scale bar = 100 μm, measurement of coverage of collagen in wound was made from at least six embryos per condition and at least five slices per embryo, one-way anova, Dunnett’s multiple comparisons test). (i) Spatial expression of two matrix metalloproteinases mmp7 and mmp9 was visualized by in situ hybridization in time 360 minutes pw (Scale bars = 500 μm). (j) RT-qPCR comparison of temporal expression profiles of mmp1, mmp8, mmp7 and mmp9 (data are normalized to 0 minutes pw in controls, three replicates, geometric mean with geometric standard deviation, two-sided ttest from log2 values of relative expression between 360 minutes and 0 minutes). **** - p < .0001, *** - p < .001, ** - p < .01, n.s. - > .05 pw – post wounding

