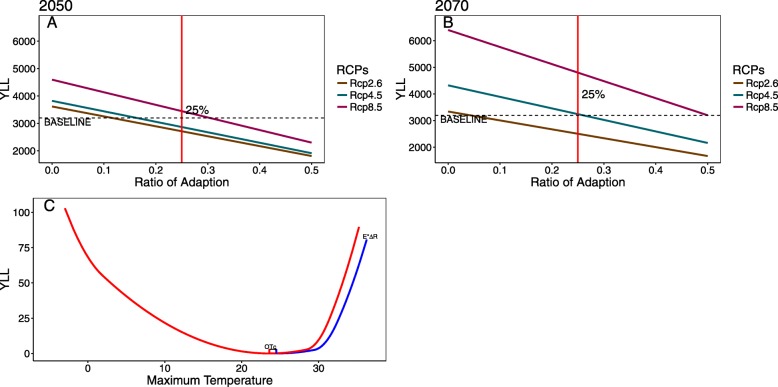
Fig. 3.
a Projections of years of life lost from ischaemic heart disease in the elderly against future heat temperature adaptations under the 3 representative concentration pathways (RCPs) in the 2050s. b Projections of years of life lost from ischaemic heart disease in the elderly against future heat temperature adaptations under the 3 representative concentration pathways (RCPs) in the 2070s. In (a) and (b), the percent adaptation necessary to offset the projected heat-related years of life lost is defined where the slopes cross the horizontal dotted line. The vertical solid red line represents the 25% adaptation assumed in the study. c Projections of years of life lost from ischaemic heart disease in the elderly according to scenarios of adaptations to heat temperatures in Tianjin, China. The blue curve indicates the percent reductions in the effects of heat temperatures due to future adaptation by E*R in the temperature space (0 < R ≤ 0.5), where E represents the effects of heat temperature; R is the ratio of adaptation; and OTc represents the optimal temperature increase. OT is assumed to increase by 1.0 °C and 1.2 °C in the 2050s and 2070s relative to the baseline, respectively

