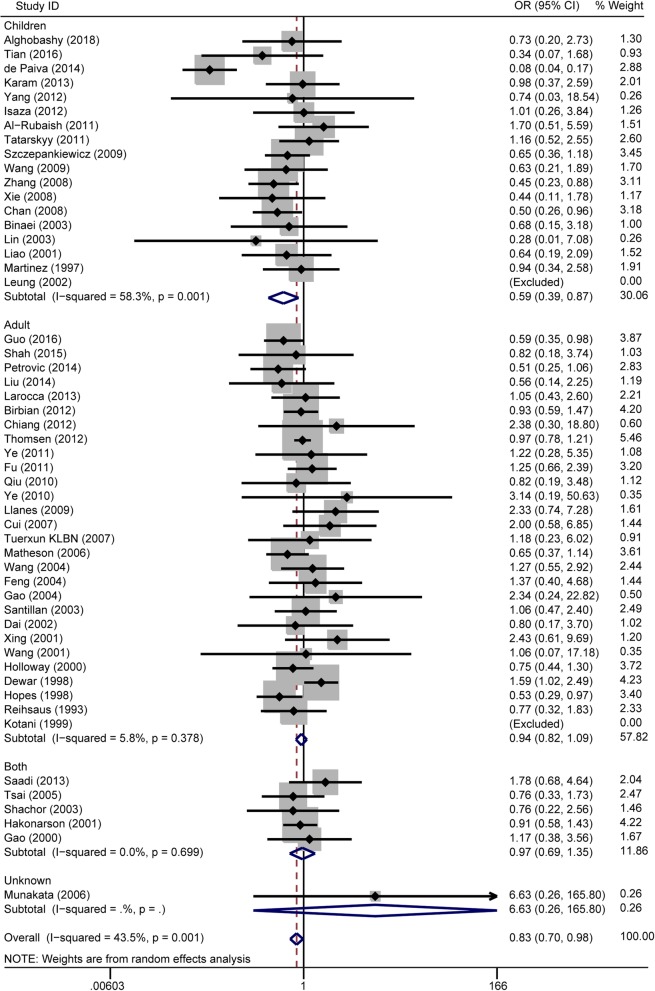
Fig. 3.
Forest plots of the association between the ADRB2 rs1042714 polymorphism and risk of asthma in recessive model comparison. GG vs. CC + CG genotype. Each study is shown by an OR estimate with the corresponding 95% CIs. The horizontal lines denote the 95% CIs and the squares represent the point OR estimate of each study. The size of the square is proportional to its inverse-variance weight in the meta-analysis. The diamond represents the pooled meta-analysis effect size estimate. The stratified meta-analysis was performed regarding the age

