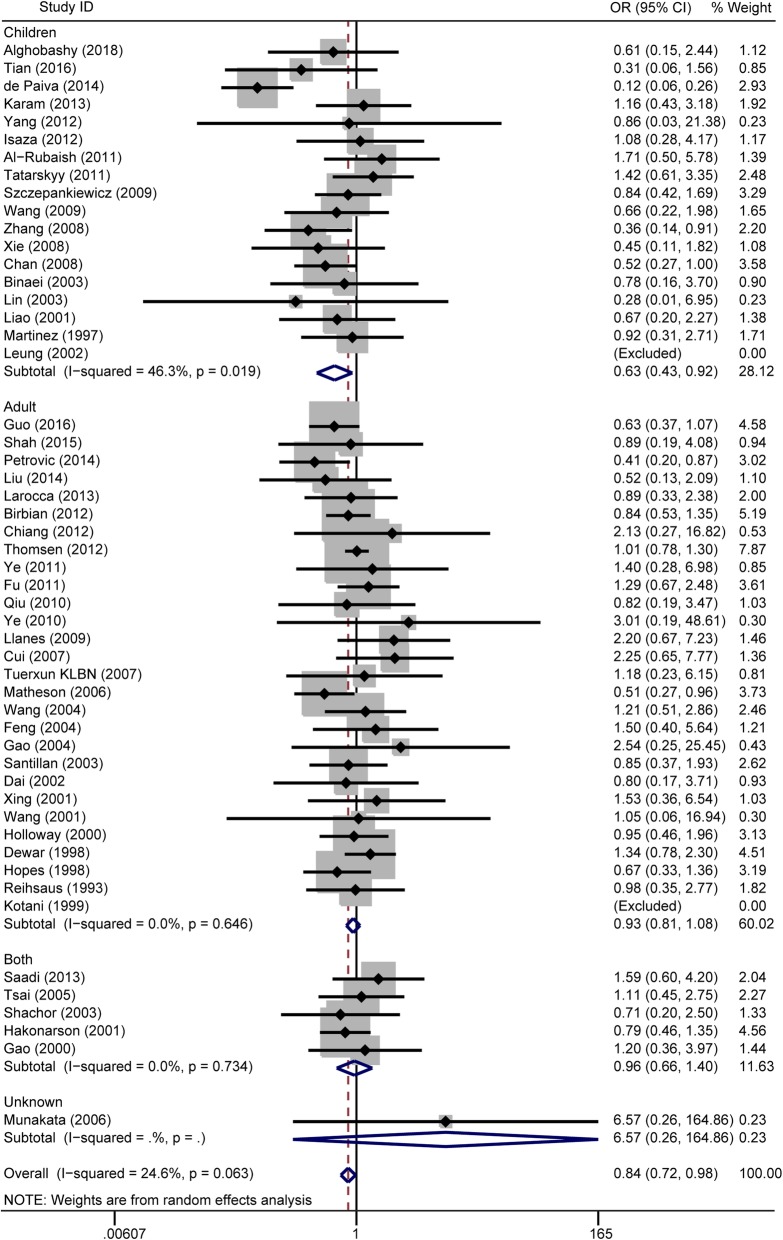
Fig. 4.
Forest plots of the association between the ADRB2 rs1042714 polymorphism and risk of asthma in homozygote genotype comparison. GG vs. CC genotype. Each study is shown by an OR estimate with the corresponding 95% CIs. The horizontal lines denote the 95% CIs and the squares represent the point OR estimate of each study. The size of the square is proportional to its inverse-variance weight in the meta-analysis. The diamond represents the pooled meta-analysis effect size estimate. The stratified meta-analysis was performed regarding the age

