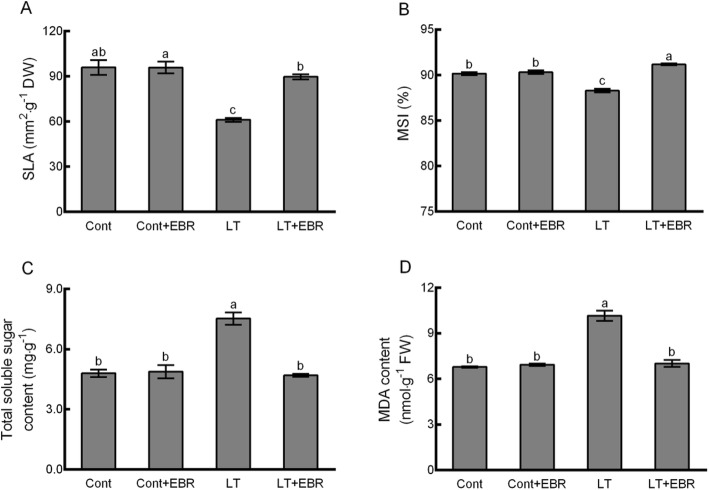
Fig. 2.
Effects of exogenous EBR application on SLA (a), MSI (b), total soluble sugar content (c), and MDA (d) in wucai leaves under LT stress. The data are represented as the means ± standard error (SE). Bars with different letters above the columns indicate significant differences (p < 0.05, Duncan’s range test) on a given day of treatment

