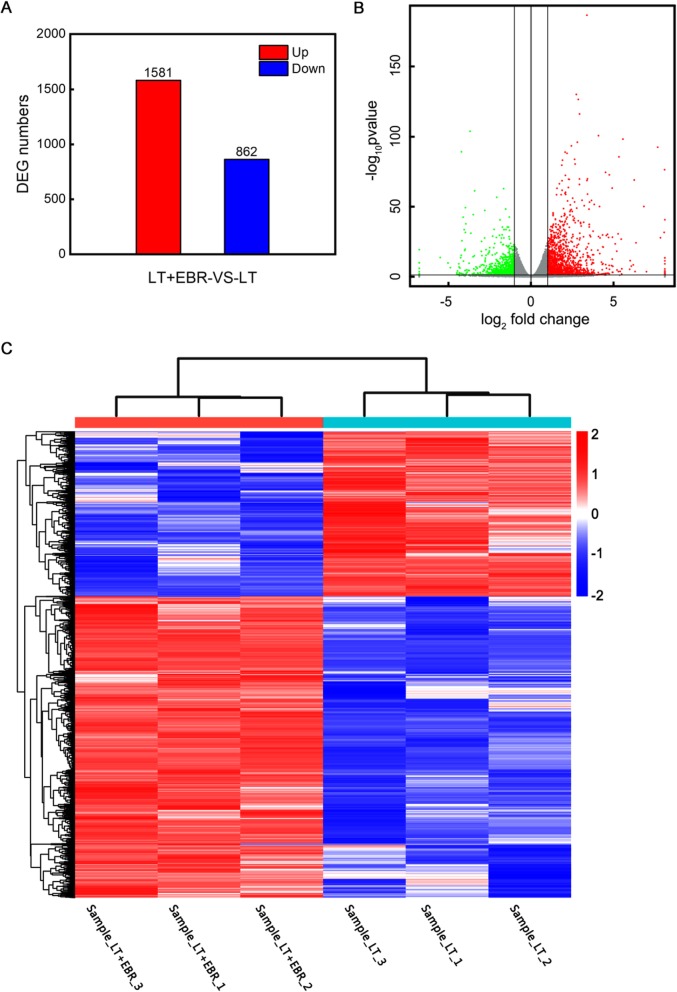
Fig. 3.
Transcriptome analysis of the DEGs in the LT and LT + EBR treatments of wucai leaves. a Comparisons of DEGs in the LT and LT + EBR treatments. b Volcano plot showing the DEGs between two different libraries. The threshold q < 0.05 was used to determine the significance of DEGs. Red and green dots represent up- and down-regulated genes, respectively, and gray dots indicate transcripts that did not change significantly in the LT + EBR library compared to LT. c Hierarchical clustering of all of the DEGs was based on the log10RPKM values. The color spectrum from blue to red represents the gene expression intensity from low to high, respectively

