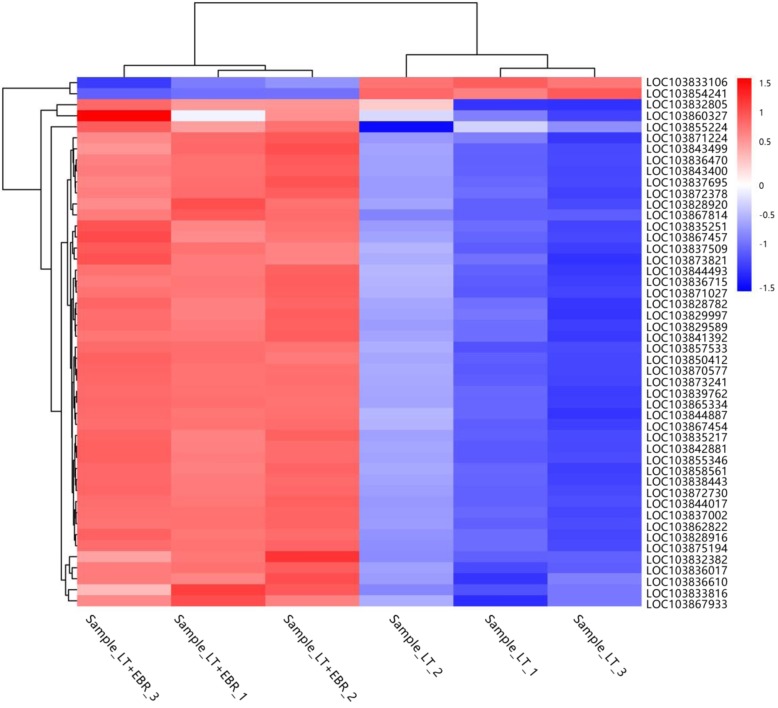
Fig. 9.
Heat map of the photosynthesis and photosynthesis-antenna proteins-related DEGs in the LT and LT + EBR treatment of wucai leaves. The log2FoldChange (FPKM) values were used to generate the heat maps using MeV software. Red and blue represent high or low expression levels, respectively, than those shown in white

