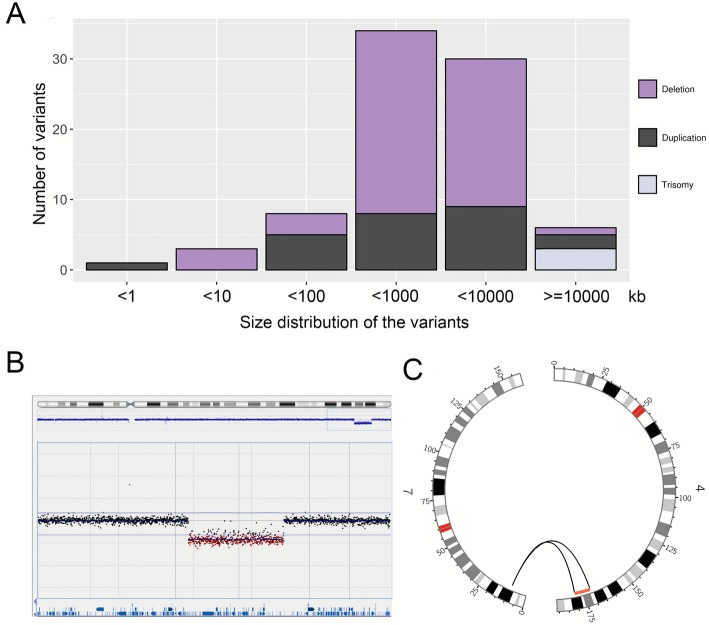
Fig. 1.
Overview of CNVs and affected individuals included in the validation cohort. a Bar graph showing the size distribution of 79 validated CNVs and three trisomies that were detected with WGS. Deletions are shown in purple, duplications in black, and trisomies in lilac. b Array comparative genomic hybridization plot indicates a heterozygous deletion of 9.3 Mb in individual RD_P77. c Circos plot illustrating the WGS results in the same individual. Discordant read pairs between chromosomes 4 and 7 are shown as gray lines, and the deletion is shown in red

