. 2019 Jul 8;10(34):7946–7951. doi: 10.1039/c9sc01410a

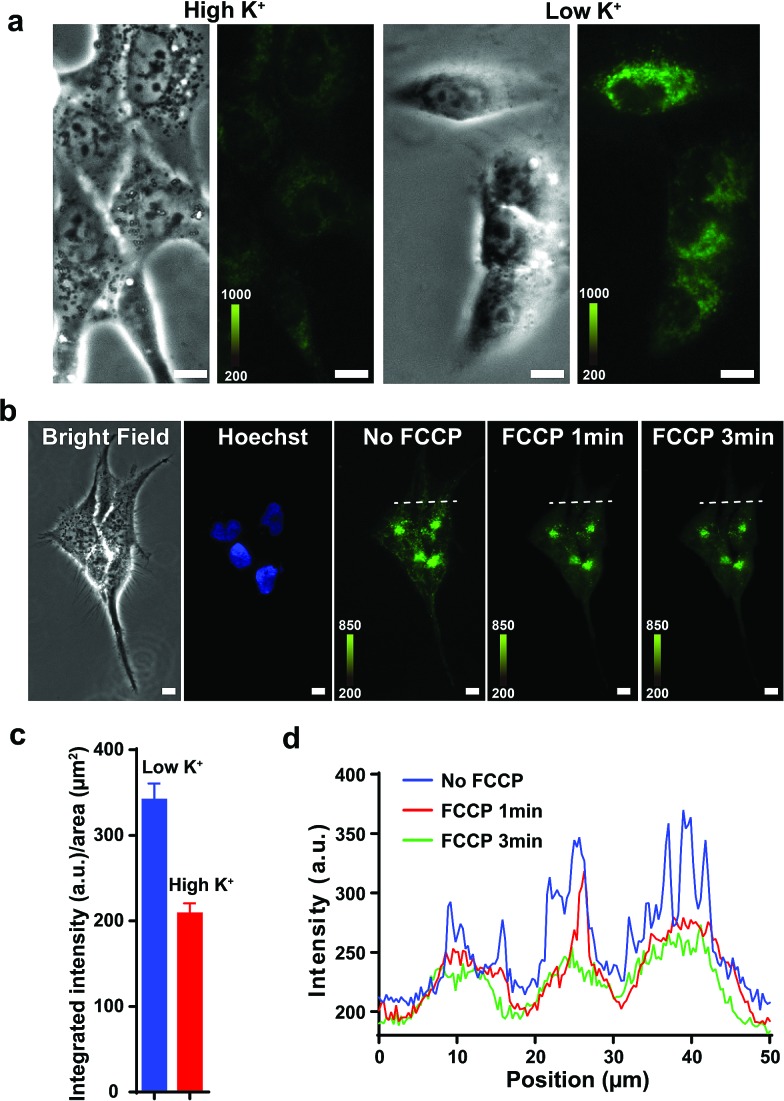
Fig. 3. (a) Fluorescent signal in H838 cells' mitochondria in high K+ and low K+ buffers after incubation with 5BMF for 30 min. Left: bright field image. Right: fluorescence image. (b) 5BMF fluorescent signal in H838 cells' mitochondria before and after FCCP was added. From left to right, H838 cells bright field imaging, Hoechst staining of the nucleus, 5BMF staining of mitochondria (GFP channel, green) without FCCP, and 5BMF staining after adding FCCP for 1 and 3 min. All images were taken with a 20× objective lens. (c) Mean fluorescence density of cells in low K+ and high K+ buffers. (d) Cross-sectional fluorescence intensity profiles taken along white-dashed lines of (b). White scale bar: 10 μm.

Fig. 3