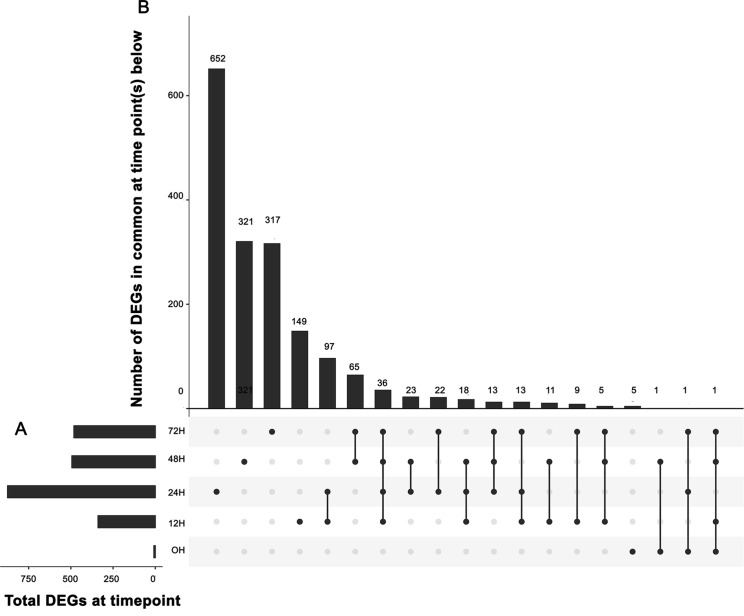
Figure 2.
UpSet plot of differentially expressed genes. (A) Graph of total number of differentially expressed genes (DEGs) (X axis) at each time point (Y axis). (B) Intersection of sets of genes at multiple time points. Each column corresponds to a time point (first four columns) or set of time points (dots connected by lines below the X axis) containing the same DEGs. The number of genes in each set appears above the column, while the time points shared are indicated in the graphic below the column, with the time points on the left.

