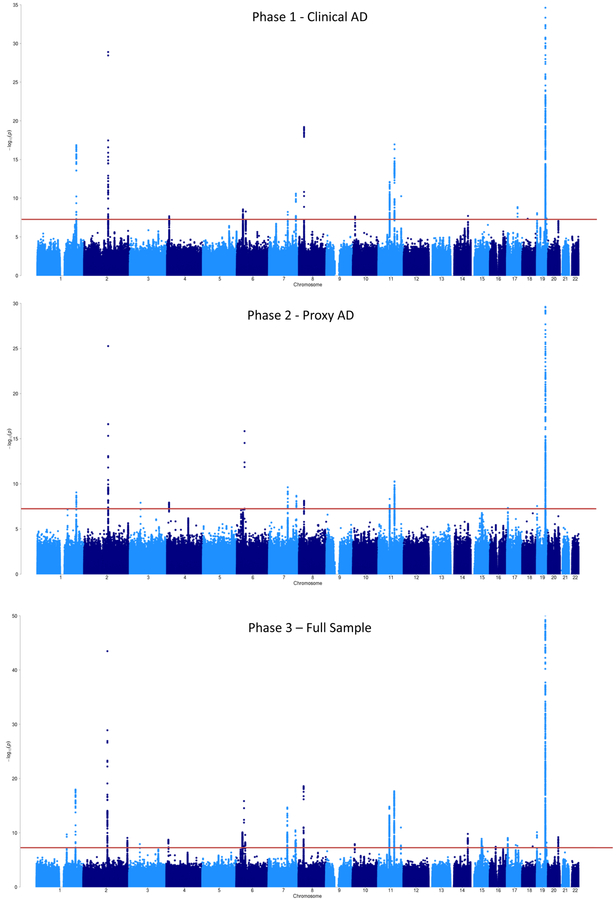
Figure 2. GWAS meta-analysis for AD risk (N=455,258).
Manhattan plot displays all associations per variant ordered according to their genomic position on the x-axis and showing the strength of the association with the −log10 transformed P-values on the y-axis. The y-axis is limited to enable visualization of non-APOE loci. For the Phase 3 meta-analysis, the original −log10 P-value for the APOE locus is 276.

