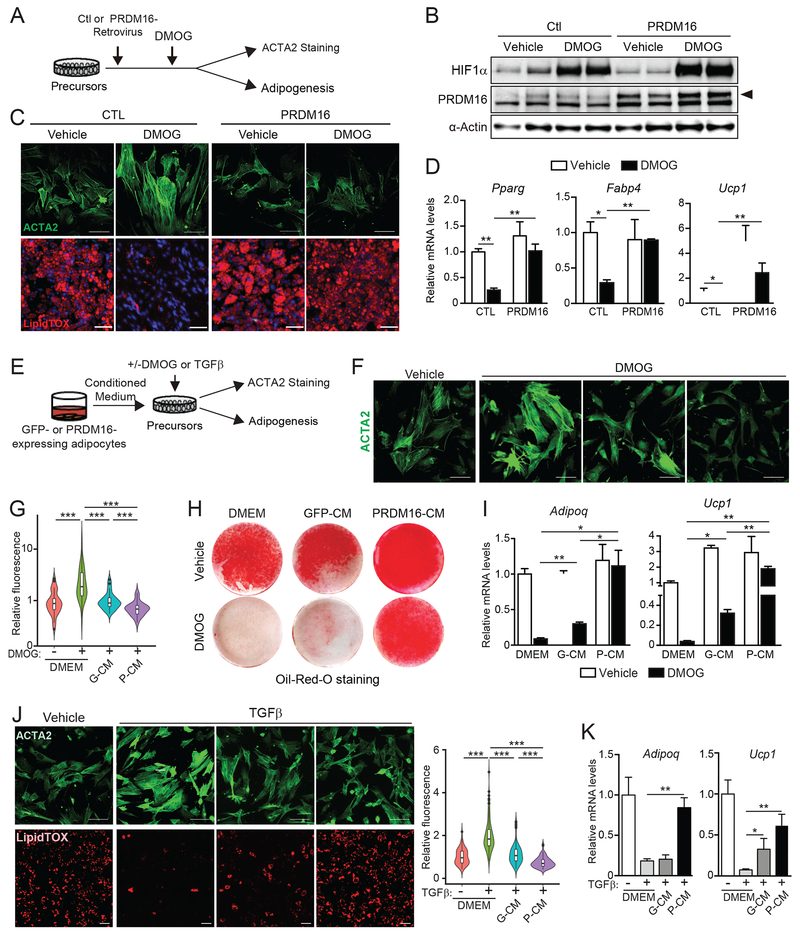
Fig.3. Adipocyte PRDM16 controls precursor fate through a paracrine pathway.
(A-D) iWAT precursor cells were transduced with control (CTL) or PRDM16-expressing retrovirus and treated with either vehicle control (CTL) or DMOG. After 2 days, cells were immunostained for ACTA2 or induced to differentiate into adipocytes for 5 days.
(A) Experimental schema.
(B) Western blot analysis of HIF1α, PRDM16 and α-Actin protein levels.
(C) ACTA2 immunostaining (green) (top panel) and LipidTOX staining (red) of lipid droplets in differentiated adipocytes (bottom panel). Scale bar, 100 μM (top); 200 μM (bottom).
(D) Relative mRNA levels of adipocyte genes. n=3 per group.
(E-K) iWAT precursor cells were treated with: (1) control medium (DMEM), conditioned medium (CM) from GFP-expressing adipocytes (GFP-CM), or CM from PRDM16-expressing adipocytes (P-CM); and (2) vehicle, DMOG or recombinant TGFβ. After 24 h, cultures were immunostained for ACTA2 or induced to differentiate into adipocytes for 5 days.
(E) Experimental schema.
(F) ACTA2 immunostaining (green). Scale bar, 100 μm.
(G) Violin plots showing relative fluorescent intensity per cell in indicated groups. The white solid boxes represent percentiles (bottom of box = 25th, horizontal line =50th, top of box = 75th). n=50-80 cells per condition.
(H) Oil-Red-O staining (red) of adipocyte lipid droplets.
(I) Relative mRNA levels of adipocyte markers in cultures from (H). n=3-5 per group.
(J) ACTA2 immunostaining (top; green) and LipidTOX staining (bottom; red) of adipocyte lipid droplets in cultures treated with indicated CM and either vehicle or TGFβ. Scale bar, 100 μm. Violin plots showing relative fluorescent intensity per cell (right).
(K) Relative mRNA levels of adipocyte marker genes in cultures from (J). n=3-5 per group.
All data presented as mean ± sem. Analysis by two-way ANOVA with Tukey correction.

