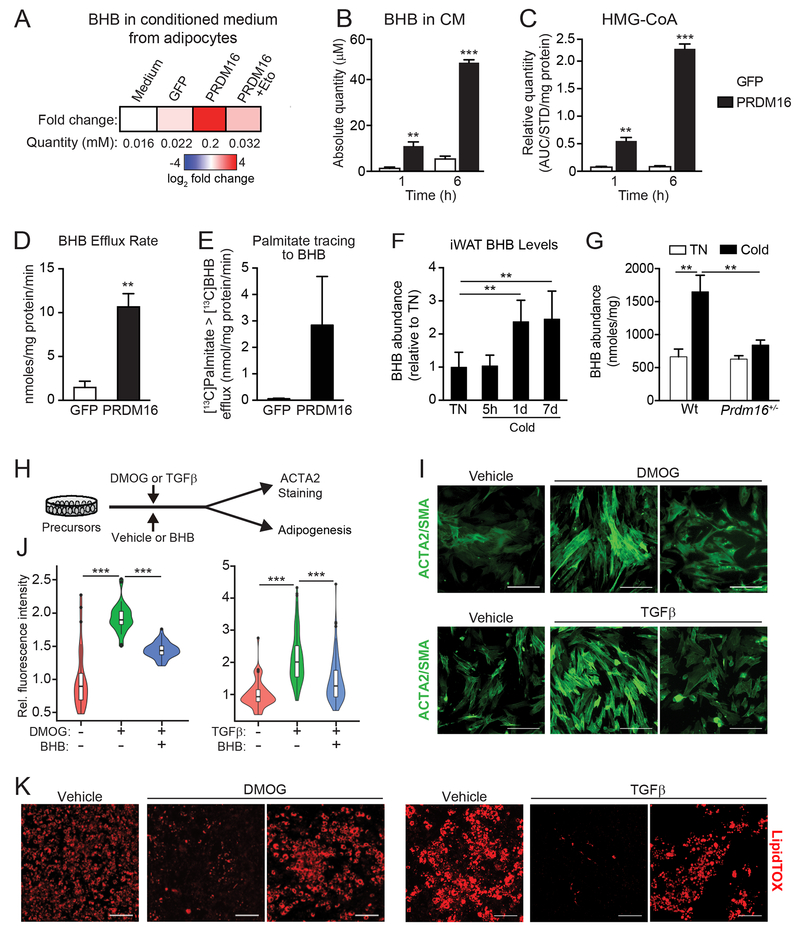
Fig.5. PRDM16 drives the production of β-hydroxybutyrate (BHB), which suppresses fibrogenesis.
(A) BHB concentration in control (GFP) and adipocyte conditioned medium in the presence or absence of Eto-treatment, as determined by LC-MS.
(B) Absolute quantity of BHB in GFP-CM and P-CM collected at 1h and 6h time points. n=4 per group.
(C) Relative quantity of HMG-CoA in GFP- and PRDM16-expressing adipocytes at 1h and 6h time points. AUC, area under the curve. AUC for HMG-CoA was normalized to 13C315N1HMG-CoA internal standard (STD) and total protein in each sample. n = 4 per group.
(D) BHB efflux rate in GFP- and PRDM16-expressing adipocytes. n=4 per group.
(E) GFP- and PRDM16-expressing adipocytes were incubated with 13C-palmitate. The absolute amount of 13C-labeled BHB in CM was measured at 1h and 6h time points. n=4 per group
(F) Relative BHB levels in iWAT from mice housed at thermoneutrality or exposed to 5°C cold for indicated times. n=5 per group.
(G) BHB levels in IWAT of wildtype (wt) control and Prdm16+/− mice housed at thermoneutrality or exposed to cold for 8 d. n= 3-6 per group.
(H-K) Adipose precursors were treated with: (1) vehicle or BHB (250 μM); and (2) vehicle, DMOG, or TGFβ. After 2 days, cells were either immunostained for ACTA2 or induced to differentiate into adipocytes for 5 days.
(H) Experimental schema.
(I) Immunofluorescence staining of ACTA2. Scale bar, 100 μM.
(J) Violin plots showing relative fluorescent intensity per cell in indicated groups. The white solid boxes represent percentiles (bottom of box = 25th, horizontal line =50th, top of box = 75th). n=50-80 cells per condition.
(K) LipidTOX staining of adipocyte lipid droplets. Scale bar, 200 μM.

