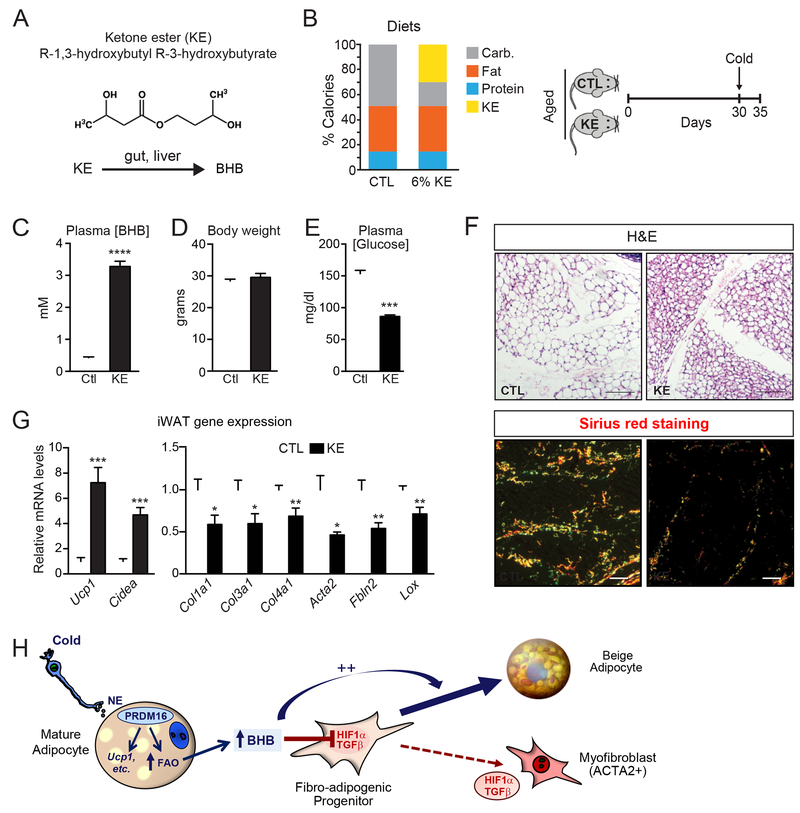
Fig. 7. Raising BHB levels in aged mice alleviates adipose fibrosis and restores beige adipogenic potential.
(A) Metabolism of the ketone ester (R-1,3-hydroxybutyl R-3-hydroxybutyrate) (KE) in the gut and liver to form BHB.
(B) Composition of control (CTL) and 6% KE diet (left) and schema of experiment (right). Aged (12-month-old) mice were fed with CTL or KE diet for 1 month at room temperature and then switched to 4°C cold for 4 days.
(C-E) Plasma BHB levels (C), body weight (D), and plasma glucose levels (E) of experimental mice. n=10 for control diet group; n=8 for KE diet group.
(F) Hematoxylin & Eosin (H&E) staining (top) and Picrosirius red staining (bottom)of iWAT from mice described above (B). Scale bar, 50 μM.
(G) Relative mRNA levels of thermogenic and fibrosis marker genes in iWAT.
All data presented as mean ± sem; *p< 0.05, **p<0.01, ***p<0.001 as analyzed by two-tailed Student’s t-test.

