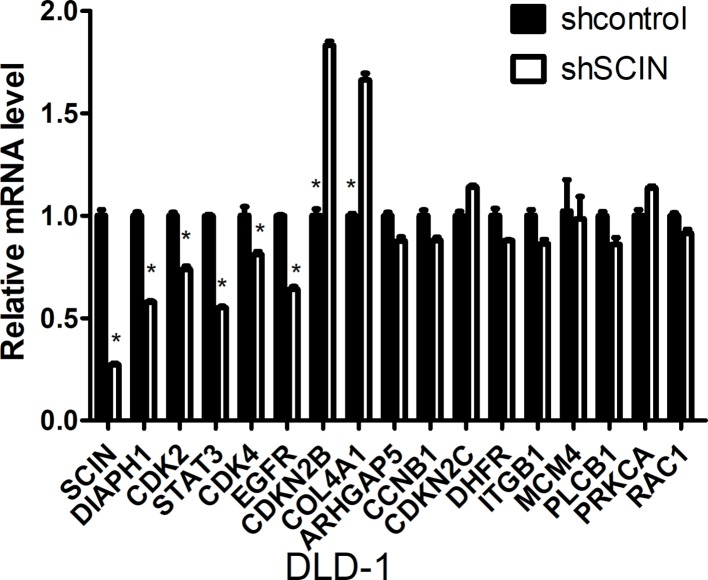
FIGURE 5.
qRT-PCR validation of candidate genes between DLD-1-shSCIN and DLD-1-shCon cells by microarray analysis. Between DLD-1-shSCIN and DLD-1-shCon cells, DIAPH1, CDK2, STAT3, CDK4, and EGFR RNA were significantly downregulated, whereas CDKN2B and COL4A1 RNA were significantly upregulated. The data shown represent the mean ± s.e.m of the experiment performed in triplicate (*P < 0.05).

