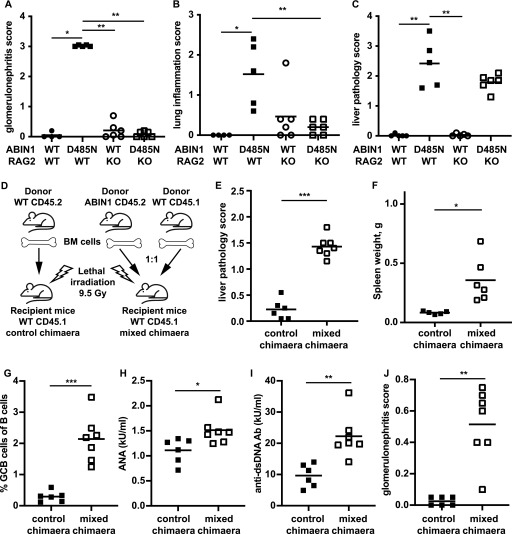
Figure 2. Glomerulonephritis but not liver pathology is independent of the adaptive immune system in ABIN1[D485N] mice and requires one or more myeloid cell types.
(A, B, C) glomerulonephritis (A), lung inflammation (B), and liver pathology (C) from 24 to 26-wk-old WT, ABIN1[D485N], RAG2 KO, and ABIN1[D485N] × RAG2 KO mice (4–6 mice of each genotype). (D) Schematic showing how the bone marrow chimaera was generated. (E, F, G, H, I, J) show Liver pathology score (E), spleen weights (F), splenic GCB cells (B220+ve CD95+veGL-7+ve) as a % of the total B220+ve B cells (G), ANA (H) and anti-dsDNA antibodies (I), and glomerulonephritis scores (J) from control and mixed chimaeric mice (5–7 mice of each experimental group). (A, B, C, E, F, G, H, I, J) Each symbol shows the data from a single mouse. Significance of the difference between the two groups was calculated using the unpaired t test with Welch’s correction (E, F, I, J), or the Mann–Whitney test (A, B, C, G); * denotes P < 0.05, ** denotes P < 0.01, and *** denotes P < 0.001.
Source data are available for this figure.

