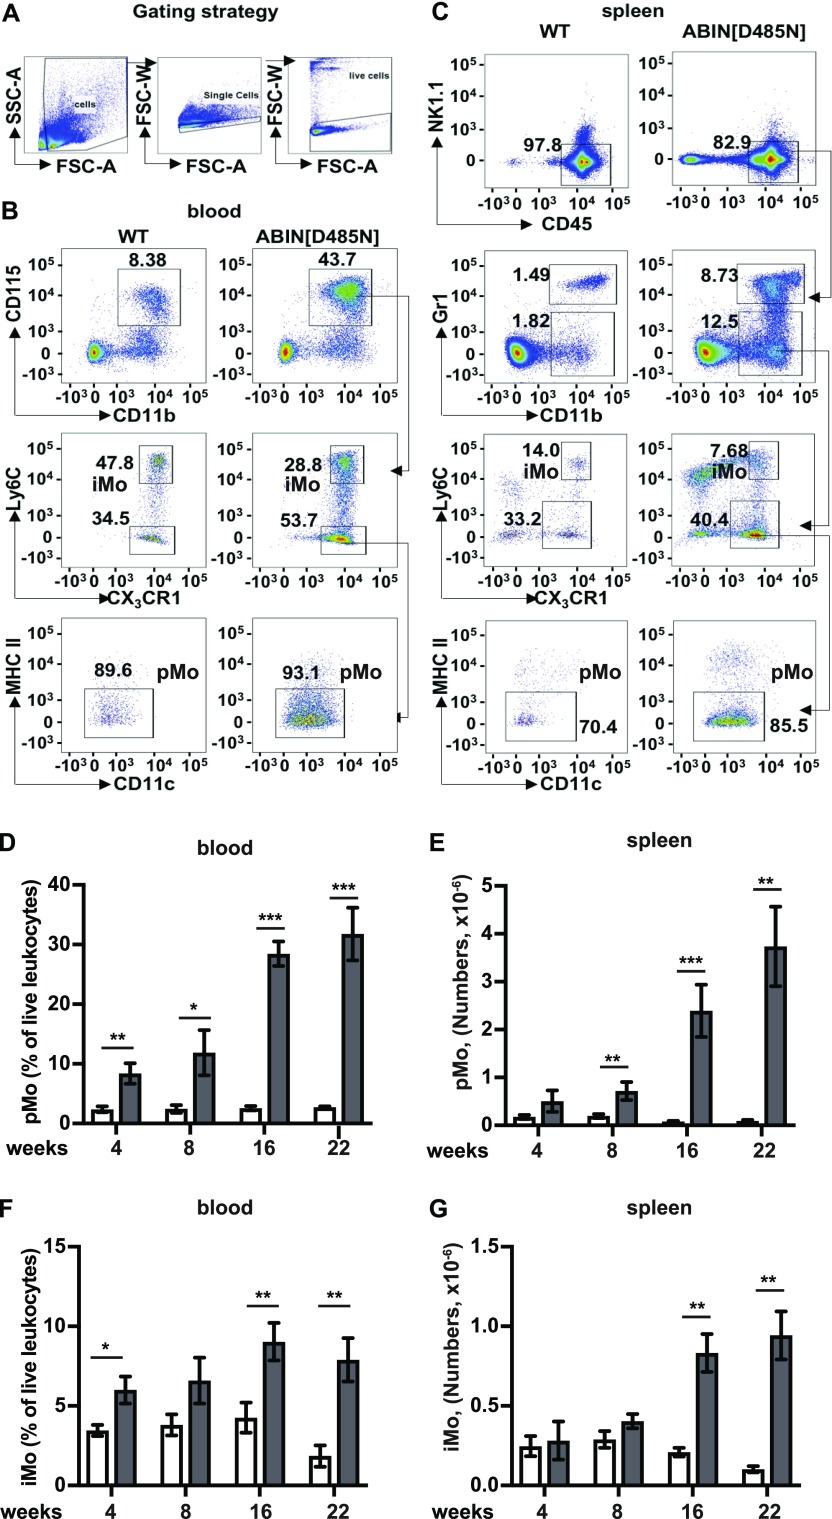
Figure 4. Characterisation of the monocyte populations in the blood and spleen of ABIN1[D485N] mice.
(A) The cells were gated based on Forward Scatter - Area (FSC-A) and Side Scatter - Area (SSC-A) followed by exclusion of doublets and dead cells. (B, C) Flow cytometry characterization of monocytes in the blood (B) and spleen (C) of 22-wk-old mice. Patrolling monocytes (pMo) in the blood were characterised as CD115+veCD11b+veLy6C−veCX3CR1+veMHCII−ve and inflammatory monocytes (iMo) as CD115+veCD11b+veLy6C+veCX3CR1+ve. Splenic pMo were identified as CD45+veGr-1−ve/lowNK1.1−veCD11b+veLy6C+veCX3CR1+veMHCII−ve and splenic iMo as CD45+veGr-1−ve/lowNK1.1−veCD11b+veLy6C+veCX3CR1+ve. (D, F) pMo (D) and iMo (F) are shown as a % of the live leukocytes in the blood of WT mice (white bars; n = 6–10) and ABIN1[D485N] mice (grey bars; n = 6–8). (E, G) Same as (D) and (F), except that the total numbers of pMo and iMo in the spleen were measured. The error bars show ± SEM. (D, E, F, G) Significance between the genotypes at each time points was calculated using the unpaired t test with Welch’s correction in (D, F) or the Mann–Whitney test (E, G); *denotes P < 0.05, ** denotes P < 0.01, and *** denotes P < 0.001.
Source data are available for this figure.

