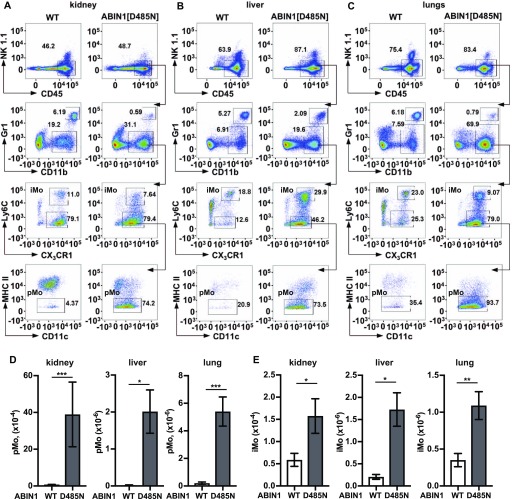
Figure 5. Characterisation of the monocyte populations in the kidney, liver, and lungs of ABIN1[D485N] mice.
(A, B, C) Same as (C) in Fig 4, except that the pMo and iMo in the kidney (A), liver (B), and lungs (C) were analysed. (D, E) Numbers of pMo (D) and iMo (E) in the kidney, liver, and lungs of 20–22-wk-old WT mice (white bars; n = 6) and ABIN1[D485N] mice (grey bars; n = 6). The error bars show ± SEM. (D, E) Significance between the genotypes was calculated using the unpaired t test with Welch’s correction in (D) (liver) and (E) (liver and kidney) or the Mann–Whitney test in (D) (kidney and lung) and (E) (lung); * denotes P < 0.05 and ** denotes P < 0.01.
Source data are available for this figure.

