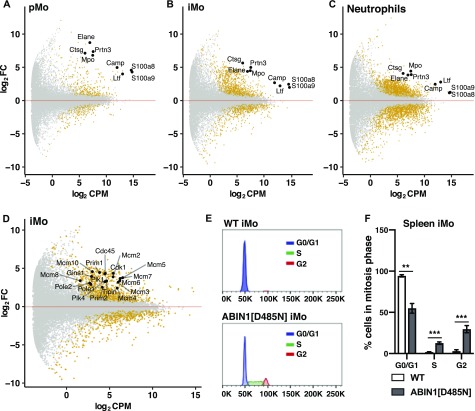
Figure 7. RNA-seq of splenic monocytes and neutrophils in ABIN1[D485N] mice.
(A, B, C) MA (M - log ratio and A - mean average) plots showing differential expression of selected genes in pMo (A), iMo (B), and neutrophils (C) obtained by RNA-seq analysis of cells purified from the spleens of 20–22-wk-old WT (n = 4) and ABIN1[D485N] mice (n = 4). Significantly up-regulated or down-regulated genes are shown in yellow. The Y-axis shows log2 fold change and X-axis shows log2 of normalized gene expression (counts per million [cpm]) in the ABIN1[D485N] cells. (D) As in B, except that up-regulated genes involved in regulating cell division in ABIN1[D485N] iMo are shown. (E, F) Representative flow cytometry plots (E) and bar graph (F) showing cell cycle analysis of iMo in the spleens of 14-w-old WT (n = 4) and ABIN1[D485N] (n = 3) mice. (F) Statistical significance between the genotypes was calculated using two-way ANOVA and the Sidak post hoc test (F); *** denotes P < 0.001.
Source data are available for this figure.

