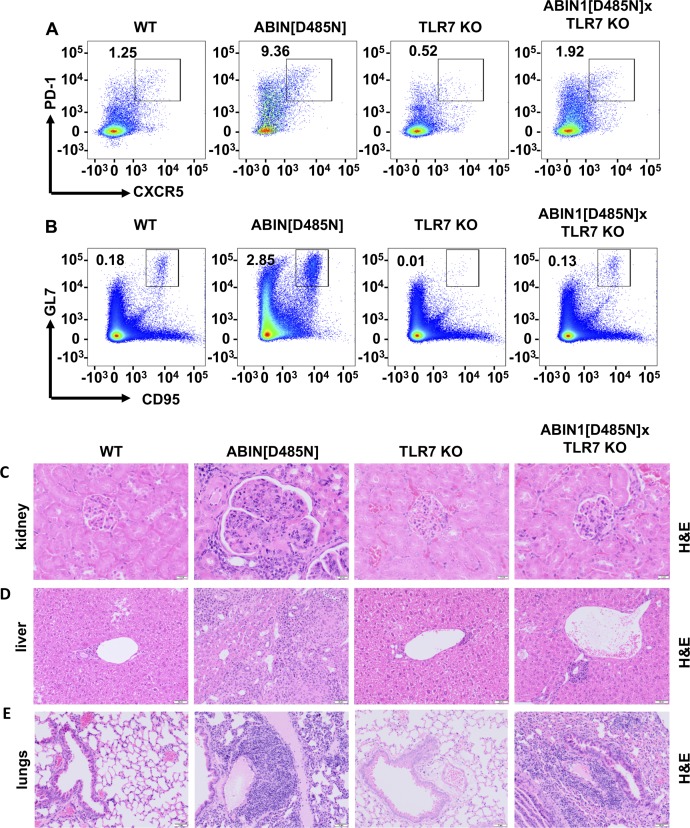
Figure S3. The increase in splenic Tfh and GCB cells, glomerulonephritis is reduced, and liver pathology is reduced in ABIN1[D485N] × TLR7 KO mice, but lung inflammation is not.
(A, B) Flow cytometry analysis of splenocytes from 17-wk-old WT, ABIN1[D485N], TLR7 KO, and ABIN1[D485N] × TLR7 KO mice. (A) Representative plots showing PD-1+veCXCR5+ve Tfh cells as a % of the TCR-β+veCD4+ve gate. (B) Representative plots showing CD95+veGL-7+ve GCB cells as a % of the B220+ve gate. (C, D, E) Representative H&E-stained sections showing the extent of kidney (C), liver (D), and lung (E) pathology in 26-wk-old WT, ABIN1[D485N], TLR7 KO, and ABIN1[D485N] × TLR7 KO mice.

