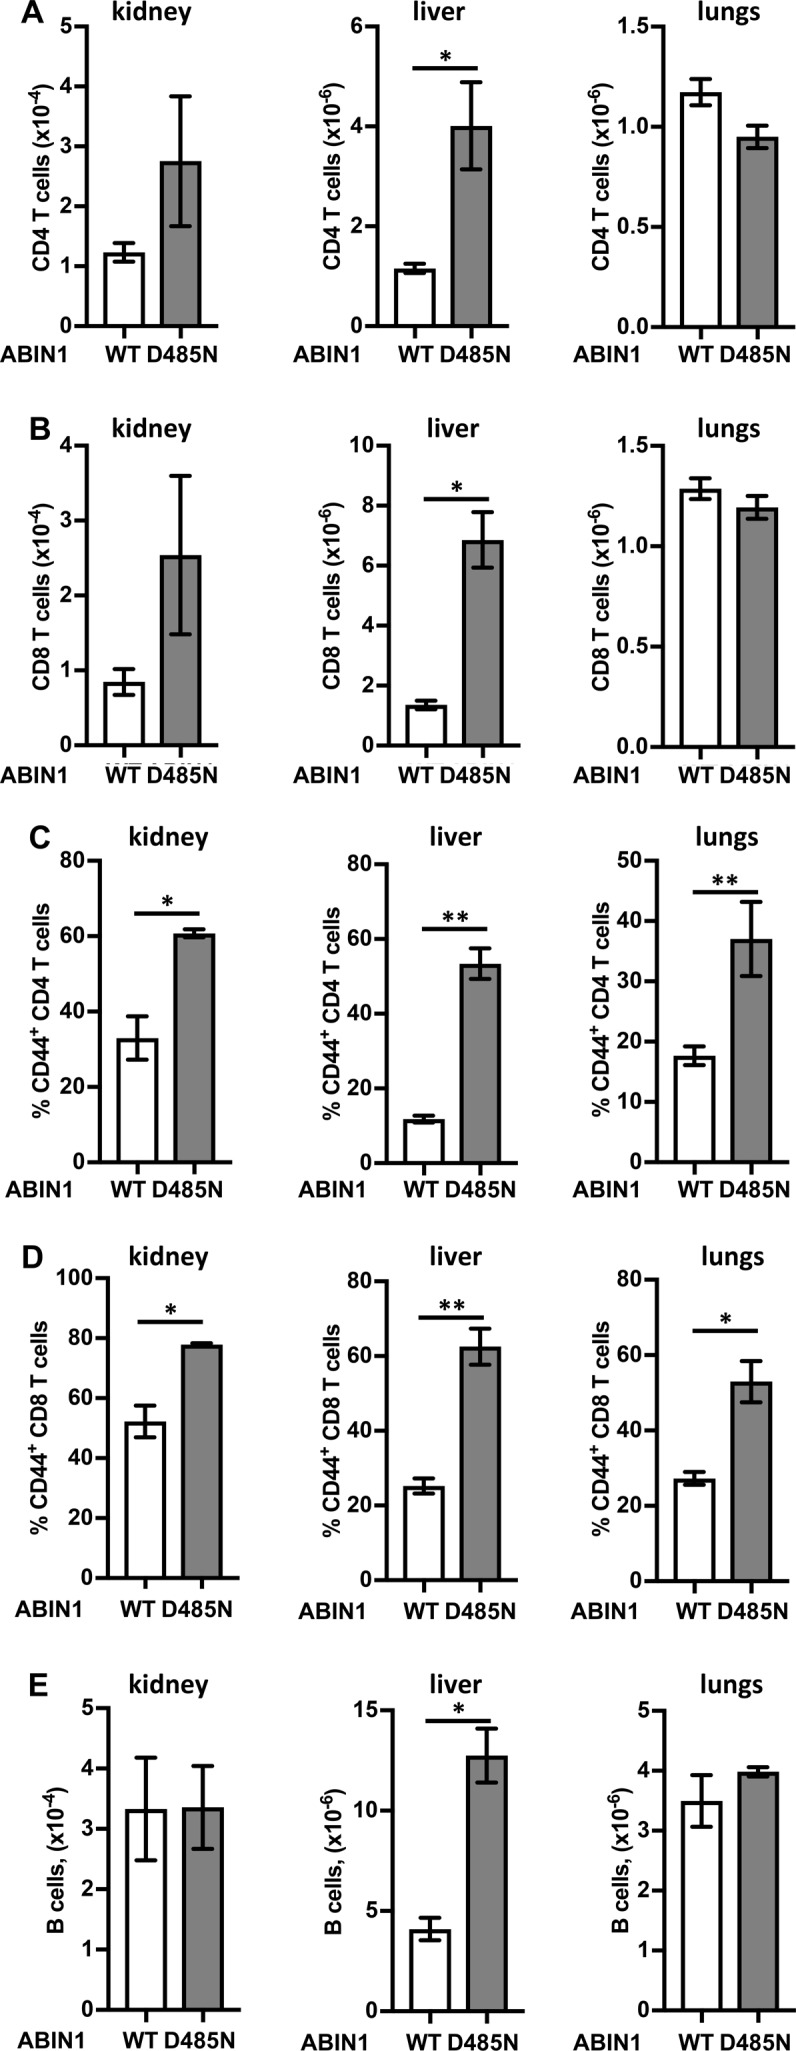
Figure S6. Infiltration of adaptive immune cells into the kidneys, liver, and lungs of wild-type and ABIN1[D485N] mice.

(A, B) Total numbers of CD4 (CD45+veCD19−veTCR-β+veCD4+ve) (A) and CD8 T cells (CD45+veCD19−veTCR-β+veCD8+ve) (B) in the kidney, liver, and lungs of 20–22-wk-old wild-type (WT) (n = 3) and ABIN1[D485N] (D485N) (n = 3) mice. (C, D) Percentage of activated CD44+ve CD4 (C) and CD8 T cells (D). (A, B, E) As in (A) and (B), except plots show total numbers of (B) cell (CD45+veCD19+ve). The error bars show SEM. Significance between the genotypes was calculated using the unpaired t test with Welch’s correction; * denotes P < 0.05 and ** denotes P < 0.01.
