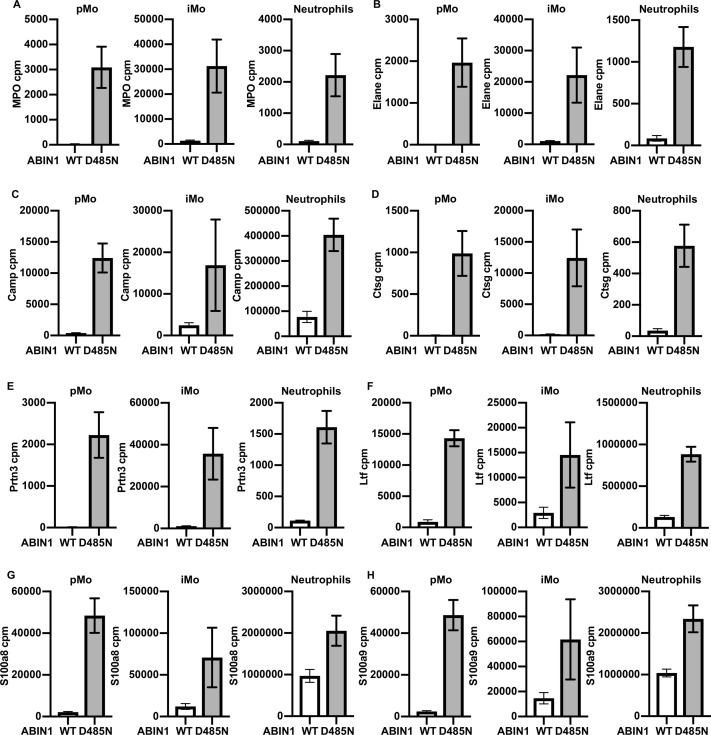
Figure S8. Increased expression of NETosis-related genes of pMo, iMo, and neutrophils in ABIN1[D485N] compared to WT mice.
(A, B, C, D, E, F, G, H) Expression of MPO (A), Elane (B), Camp (C), Ctsg (D), Prtn3 (E), Ltf (F), S100a8 (G), and S100a9 (H) in pMo, iMo, and neutrophils from WT (white bars) and ABIN1[D485N] (grey bars) mice. Bar graphs show the average values of normalized read counts obtained from RNA-seq analysis of cells purified from the spleens of 20–22-wk-old WT (n = 4) and ABIN1[D485N] mice (n = 4). Error bars indicate SEM.

