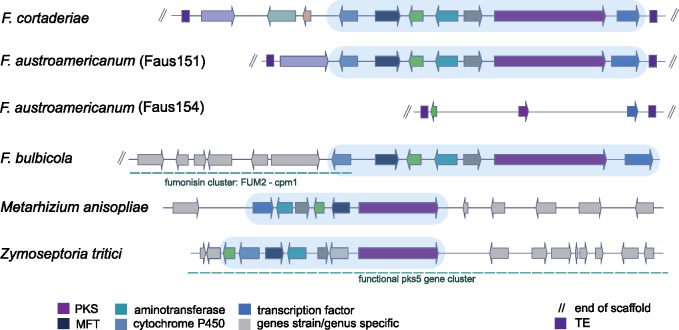
Fig. 6.
—Synteny plot of the SM53 gene cluster. Arrows of identical color correspond to homologous genes and identify the predicted protein function. Light gray arrows correspond to genes lacking homology among analyzed strains. Light blue identifies the conserved core set of genes. Blue dotted lines in Fusarium bulbicola correspond to the fumonisin cluster adjacent to the core set and in Zymoseptoria tritici to the PKS5 gene cluster upregulated during infection in wheat. PKS, polyketide synthase; MFT, major facilitator superfamily transporter; TE, transposable element.

