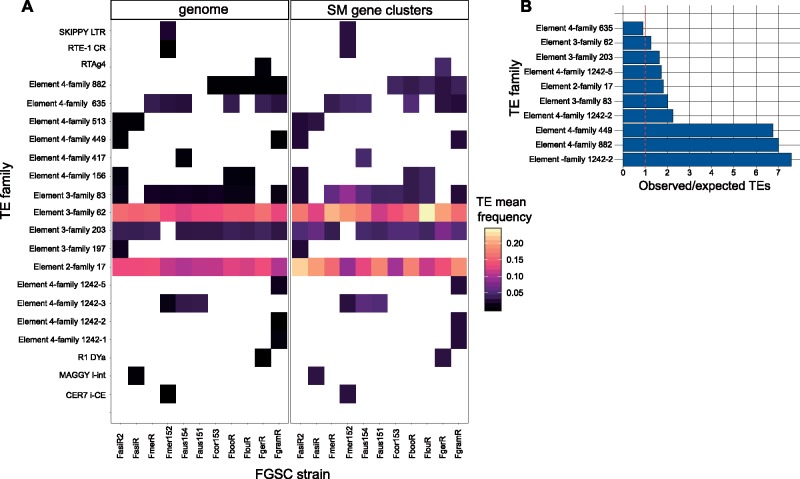
Fig. 8.
—(A) Heatmap with the most frequent transposable element families flanking FGSC gene clusters and the overall genome in 10 kb windows. (B) Bar chart showing the ratio of the observed (SM gene cluster) over the expected transposable elements (genome) in the F. graminearum reference genome (FgramR). Red dotted line marks the ratio of one representing no difference.

