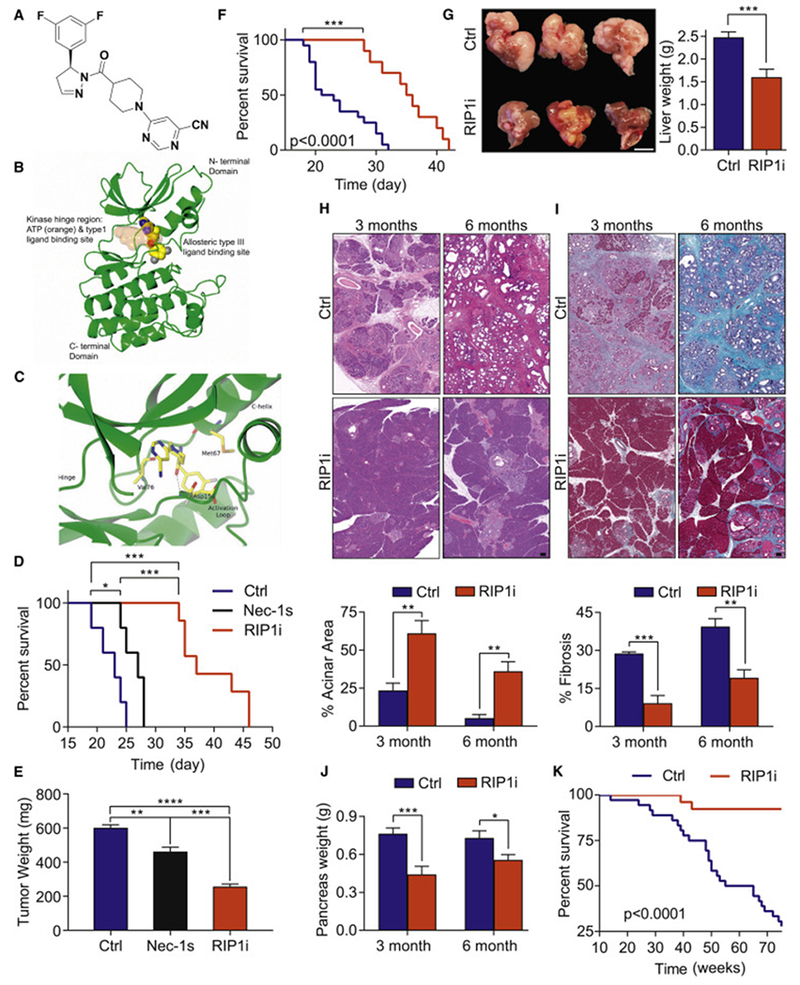
Figure 1. Targeting RIP1 using a selective kinase inhibitor is protective against PDA.

(A) Chemical structure of GSK’547 (RIP1i). (B) The binding orientation of RIP1i in an allosteric pocket of the RIP1 kinase domain produced by single crystal X-ray crystallography. Atoms of RIP1i are represented as spheres with color coding: carbon (yellow), nitrogen (blue), oxygen (red), fluorine (grey). The ATP binding pocket is shaded in orange. The allosteric pocket is located at the back of the hinge region in a deep cleft located between the north and south domains of the kinase. (C) Close-up view of RIP1i bound in the allosteric pocket of the RIP1 kinase domain. The same colour coding is used as for Figure 1B. Note the direct hydrogen-bond interaction between the amide carbonyl of RIP1i and the backbone amide NH of Asp156. (D) Survival of WT mice orthotopically implanted with KPC-derived tumor cells treated with RIP1i, Nec1s, or vehicle beginning on the day of tumor implantation quantified with the Kaplan-Meier estimator (n=5-7/group). (E) Tumor weight from additional cohorts (n=5/group) similar to (D) sacrificed on day 21. One representative of more than five repeats. (F) Kaplan-Meier survival analysis of WT mice administered RIP1i (n=10) or control (n=15) beginning on day 10 after orthotopically implanted with KPC-derived tumor cells. This experiment was repeated twice. (G) Representative images of livers (scale bar = 1 cm) and quantification of liver weights of WT mice injected with KPC-derived tumor cells via the portal vein and treated with RIP1i or control beginning on day 5 after tumor challenge. Mice were sacrificed at 21 days (n=8/group). This experiment was repeated 4 times. (H-J) Representative images of H&E (H) and Gomori Trichrome (I) staining (scale bars = 100 μm) and the percentages of preserved acinar (H) and fibrotic (I) area as well as pancreatic weights (J) of pancreas harvested from KC mice fed with RIP1i-containing or control chow beginning at 6 weeks of life at 3 months and 6 months (n=8). (K) Kaplan-Meier survival analysis in cohorts of RIP1i-treated (n=26) and control (n=36) KC 97 mice as in (H-J). Data are displayed as average ± SEM (*p<0.05; **p<0.01; ***p<0.001; ****p<0.0001). See also Figure S1 and Tables S1–S4.
