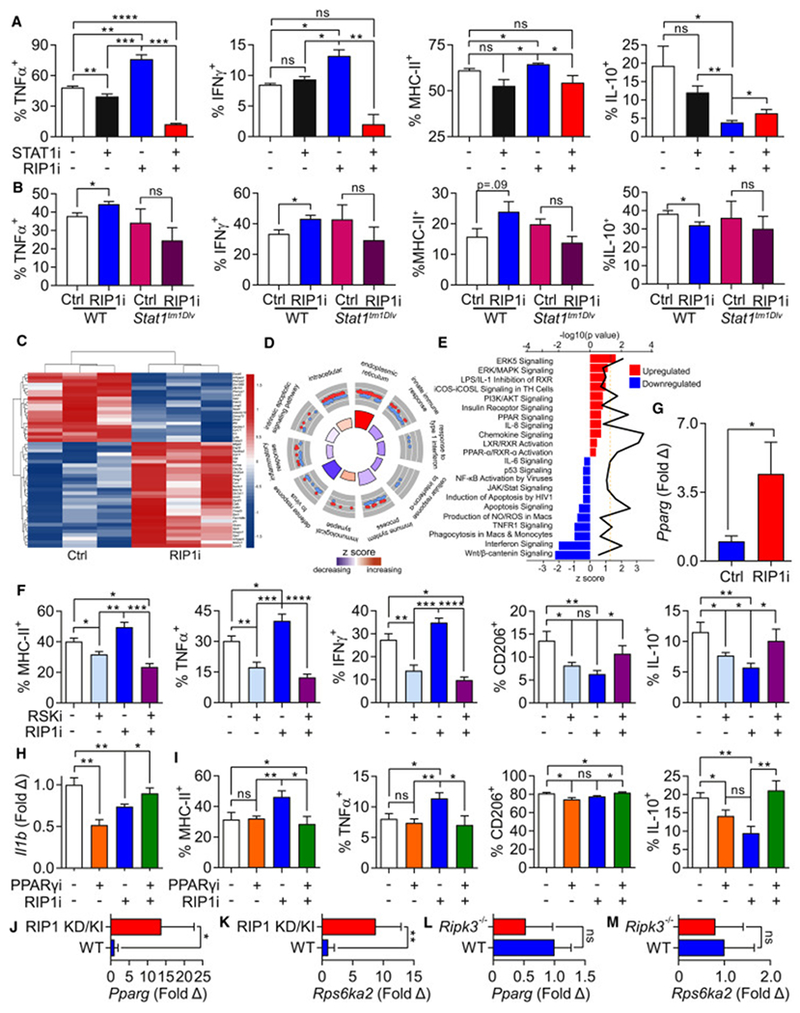
Figure 8. Signaling changes in macrophages induced by RIP1i.

(A) Expression of TNFα, IFNγ, MHC-II, and IL-10 in day 7 BMDM harvested from WT mice treated with RIP1i or vehicle, either alone or in combination with a STAT1 inhibitor (STAT1i) for 18 hr determined by flow cytometry. This experiment was performed 4 times in replicates of 5. (B) Expression of TNFα, IFNγ, MHC-II, and IL-10 in day 7 BMDM harvested from WT or Stat1tm1Dlv mice treated with RIP1i or vehicle for 18 hr determined by flow cytometry. This experiment was performed twice in replicates of 5. (C-E) Heatmap of top 50 differentially expressed genes (C), top scoring Gene Ontology (GO) terms related to innate inflammatory and immune responses (D), and canonical pathway perturbations derived using ingenuity pathway analysis (IPA) (E) from RNA-Seq analysis (in triplicates) of day 7 BMDM treated with RIP1i or vehicle for 18 hr. In (D) red (up-regulated) and blue (down-regulated) dots in outer circle show the log2FC of genes in each GO term. Bar plot colors in the inner circle are based on z-scores, and the height of each bar represents each GO term’s significance. In (E) up-regulated (red) and down-regulated (blue) pathways specific to macrophage and immune response were identified after RIP1i treatment. Z score is shown on the lower x-axis and corresponds to the length of the respective bars. P value for each pathway is indicated by the black line and the corresponding upper x-axis. The dashed line represents the threshold for statistical significance. (F) Expression of MHC-II, TNFα, IFNγ, CD206, and IL-10 in day 7 BMDM treated with RIP1i or vehicle, alone or in combination with RSK inhibitor (RSKi) for 18 hr determined by flow cytometry. This experiment was repeated three times in 5 replicates. (G) The expression of Pparg in day 7 BMDM treated for 18 hr with RIP1i or vehicle measured by qPCR. (H) The expression of Il1b in day 7 BMDM treated for 18 hr with RIP1i alone, PPARγ inhibitor (PPARγi) alone, or RIP1i + PPARγi determined by qPCR. This experiment was performed in replicates of 5 and repeated twice. (I) Expression of MHC-II, TNFα, CD206, and IL-10 in day 7 BMDM treated as in (H). This experiment was repeated twice in 5 replicates. (J, K) Expression of Pparg (J) and Rps6ka2 (K) in day7 BMDM from WT and RIP1 KD/KI mice analyzed by qPCR (n=5/group). (L, M) Expression of Pparg (L) and Rps6ka2 (M) in day 7 WT and Ripk3−/− BMDM were analyzed by qPCR (n=4/group). qPCR experiments were repeated twice. Data are displayed as average ± SEM (*p<0.05; **p<0.01; ***p<0.001; ****p<0.0001). See also Figure S5.
