
Figure 2.
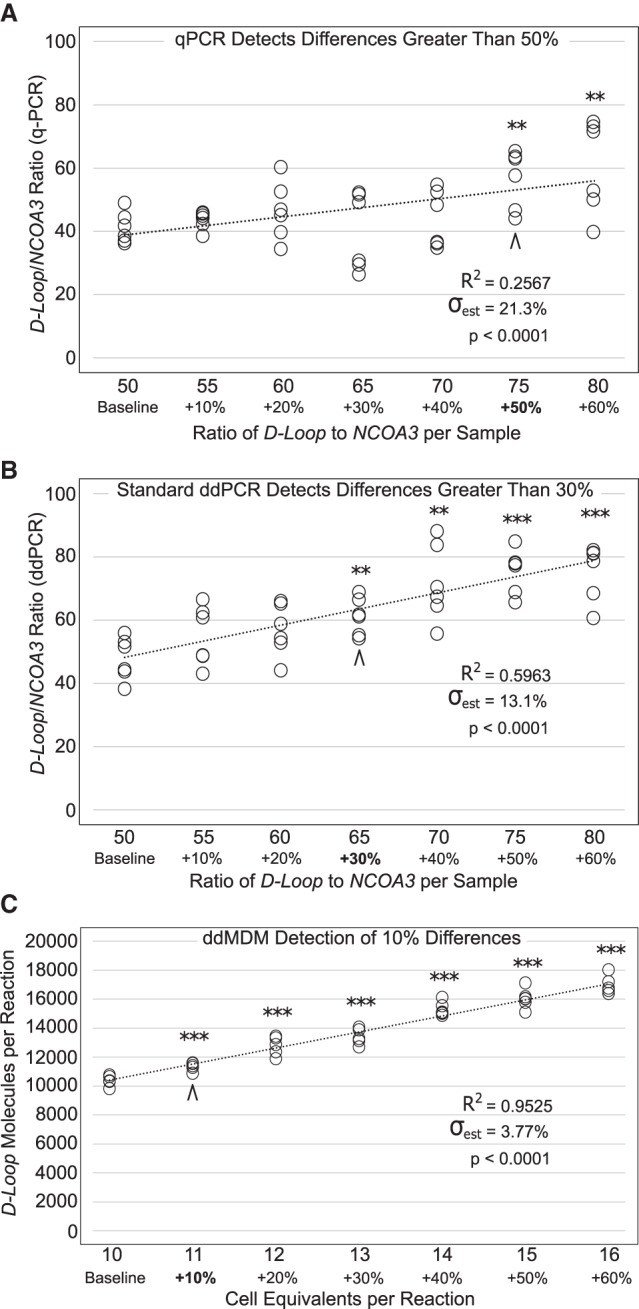
Limit of sensitivity for ddMDM and other previously reported techniques for mtDNA detection. Data points are the result of two separate experiments each performed in triplicate. Asterisks indicate significance by Student's t-test between each sample compared to the baseline control. (**) P < 0.01, (***) P < 0.001. σest displays the standard error of the estimate as a percentage, normalized to the population mean. (A) qPCR determination of D-Loop/NCOA3 ratio using purified amplicons. (B) ddPCR determination of D-Loop/NCOA3 ratio of the exact same samples employed in Figure 2A. (C) ddMDM determination of mtDNA molecules (D-Loop) per cell equivalent (stimulated T cells).