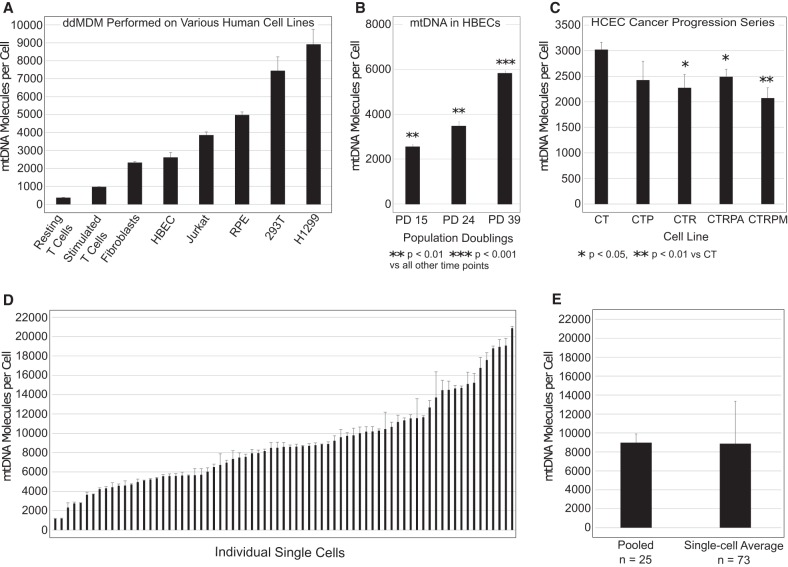
Figure 3.
ddMDM quantification of mtDNA in different cell types. (A) Absolute mtDNA molecules per cell equivalent were measured in different primary and transformed cell lines. (B) mtDNA levels in primary HBECs at the indicated population doublings. (C) mtDNA levels in human colonic epithelial cell (HCEC) cancer progression series. Error bars show the standard deviation of biological triplicates. (D) mtDNA from 73 single H1299 cells were quantified. Error bars show the standard deviation of three technical replicates for each individual cell. (E) Comparison between averages of H1299 pooled controls and of the 73 single cells.

