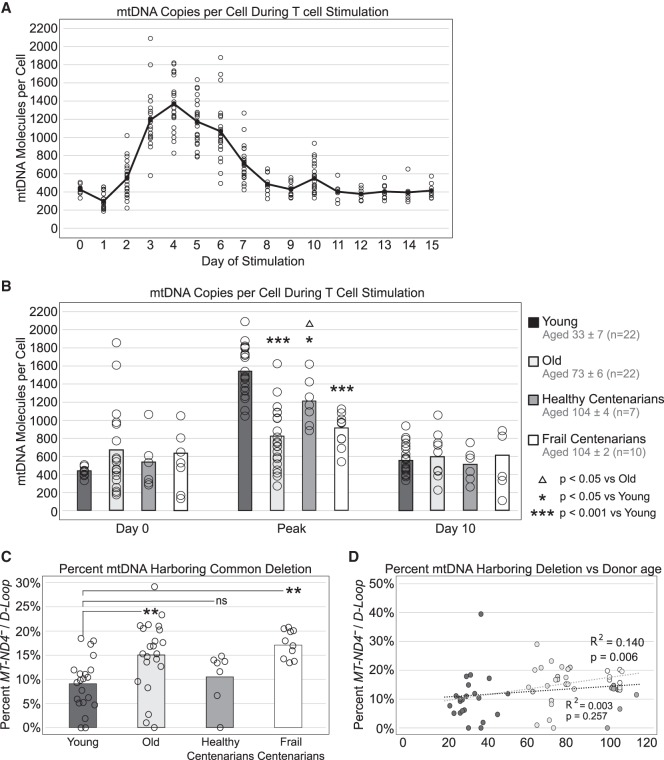
Figure 4.
mtDNA in T cells shows stimulation- and age-dependent changes. (A) T cells from 22 healthy donors (aged 33 ± 7) were stimulated at day 0 by anti-CD3/CD28 beads and mtDNA per cell equivalent was measured over a 15-d period of stimulation. Open circles represent individual mtDNA per cell from each of the 22 individuals, while the line traces the average of all individuals at each day. (B) T cells from 22 healthy young (aged 33 ± 7), 22 healthy old (aged 73 ± 6), 7 healthy centenarian (aged 104 ± 4), and 10 frail centenarian (aged 104 ± 3) individuals were stimulated as described above. mtDNA was measured over the course of the stimulation, and the highest point that mtDNA reached for each individual was designated as the “peak” mtDNA of that individual's stimulation. Shown are averages and standard deviation of the peak mtDNA of each age group. Significance was determined by one-way ANOVA. (C) MT-ND4 and D-Loop molecules were measured from T cells to show the prevalence of mutated mtDNA (carrying the 4977-bp common deletion) to total mtDNA. Significance was determined by ANOVA (Tukey's multiple comparisons). (D) The percentage of mtDNA carrying MT-ND4 deletion was plotted versus age for all 61 study participants. Linear regressions were performed for young, old, and frail centenarians (gray line) and young, old, and healthy centenarians (black line).

