Figure 2.
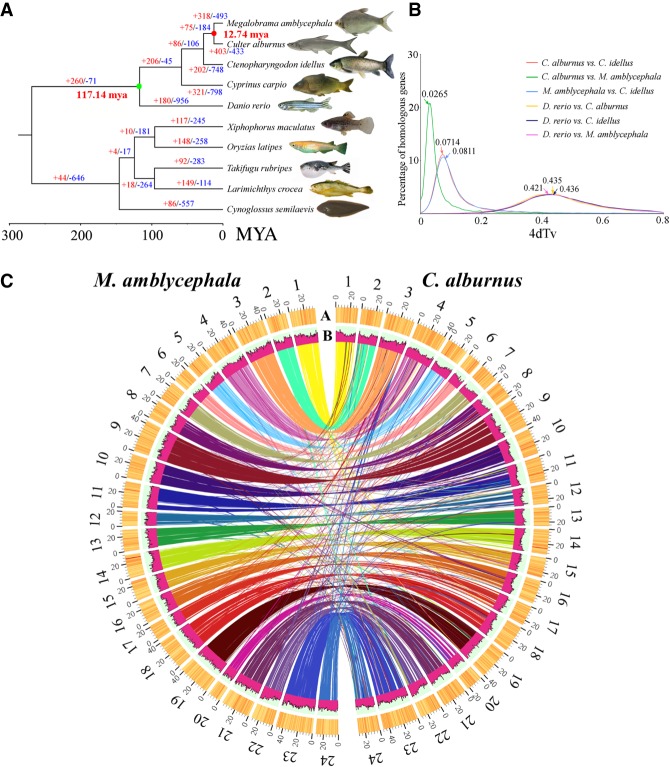
Evolution of the BSB and the TC. (A) A phylogenetic tree was constructed from 10 species, including five cyprinids. The time of divergence and the expansion and contraction of gene clusters are described with a maximum-likelihood tree. The number of expansion events in each gene clusters is indicated in red, and contraction events are indicated in blue. The photographs of Xiphophorus maculatus were obtained from Schartl et al. (2013). (B) The distribution of the synonymous substitution rates (Ks) of orthologous genes for interspecies comparisons was identified by 4dTv analysis. The peaks of the Ks distributions of orthologs indicate speciation events. (C) A comparative analysis of the BSB and TC genomes was performed. Maps of 24 BSB chromosomes and of 24 TC chromosomes based on the positions of 20,130 orthologous gene pairs showed highly conserved synteny between them. The A track represents gene density (window size = 100 kb), and the B track represents repeat content within a 500-kb sliding window.

