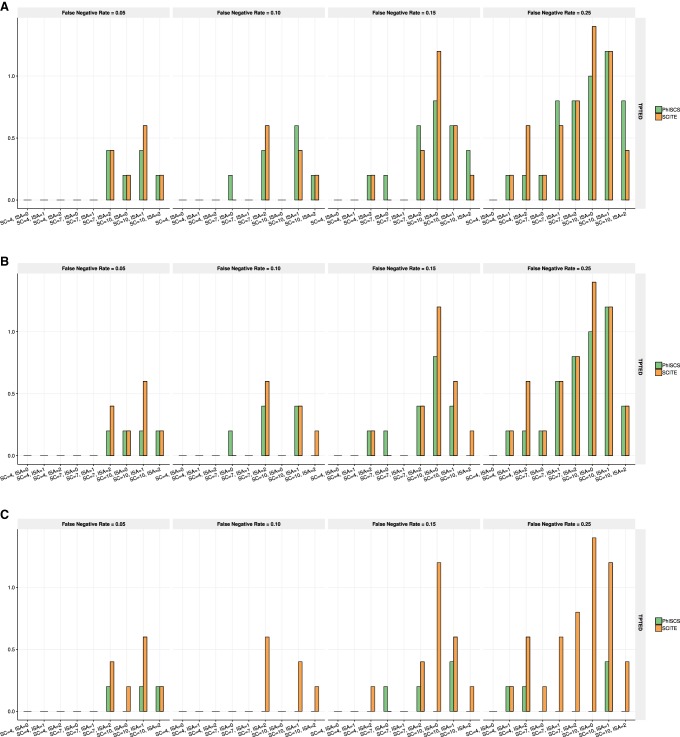
Figure 3.
Comparison of PhISCS with SCITE based on TPTED dissimilarity measure. (A) TPTED values for SCS data when no ISA violations are allowed. (B) TPTED values when ISA violations are allowed in PhISCS. (C) TPTED values when ISA violations are allowed in PhISCS and both single-cell and bulk data are used as the input. In each case, 100 single cells were sampled and the total number of simulated mutations set to 40. In C, one bulk sample was used and coverage of bulk data was set to 10,000×. SC and ISA, respectively, denote the number of subclones and the number of simulated mutations for which ISA is violated. As our results illustrate, PhISCS has a comparable performance to SCITE in the cases when only SCS data is available; however, the addition of bulk sequencing data improves the performance of PhISCS substantially.

