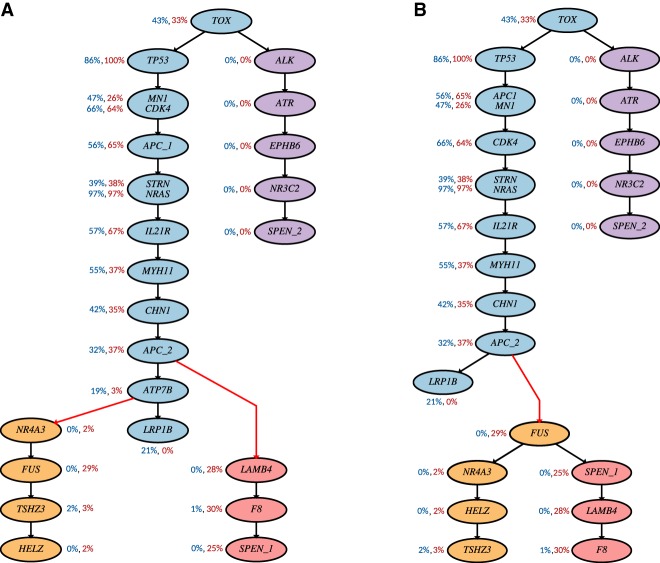
Figure 7.
Inferred tumor phylogeny for CRC2 (CO8) patient from Leung et al. (2017) by PhISCS through the use of single-cell data only: (A) without allowing mutation elimination; (B) with allowing mutation elimination. For each mutation, VAFs derived from bulk data are provided next to the gene label. The first number (colored in blue) represents VAF in the primary tumor and the second number (colored in red) represents VAF in the metastasis. Genes SPEN and APC harbor multiple mutations. SPEN_1 denotes mutation at position Chr 1, 16,258,997; SPEN_2, mutation at Chr 1, 16,202,934; APC_1, mutation at Chr 5, 112,164,646; and APC_2, mutation at Chr 5, 112,175,328. Coloring of nodes in A is motivated by the coloring used in Figure 6 in Leung et al. (2017). In this coloring, blue and purple nodes represent mutations specific to the primary site, whereas nodes colored in pink and orange represent mutations specific to two distinct metastases. Red edges represent metastatic seeding events. Coloring in B is equivalent to the coloring in A.

