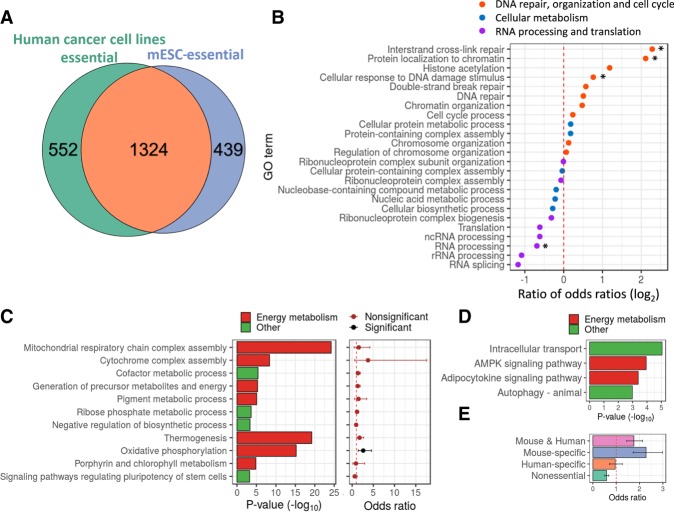
Figure 4.
Analysis of genes essential specifically in mESCs reveals pathways associated with the pluripotent state. (A) Venn diagram presenting the overlap between essential genes in mESCs and in human cancer cell lines (OR = 62.6, P < 10−16). (B) The ratio between odds ratios obtained for GO terms enrichment analysis for essential genes specific in ESCs relative to all essential genes in mESCs. (C) Significant enrichment of GO terms and KEGG pathways for genes essential specifically in mESCs (left plot), and corresponding association level of those terms with genes significantly up-regulated in mESCs relative to EpiSCs (right plot). Values are odds ratio ± 95% confidence interval. (D) Significant enrichment of GO terms and KEGG pathways for genes essential specifically in hESCs. (E) Association analysis between genes up-regulated in mESCs and genes essential specifically in (1) both human and mouse ESCs, (2) mESCs, (3) hESCs, and (4) nonessential genes. Values are odds ratio ± 95% confidence interval. (*) P < 0.05.

