Figure 6.
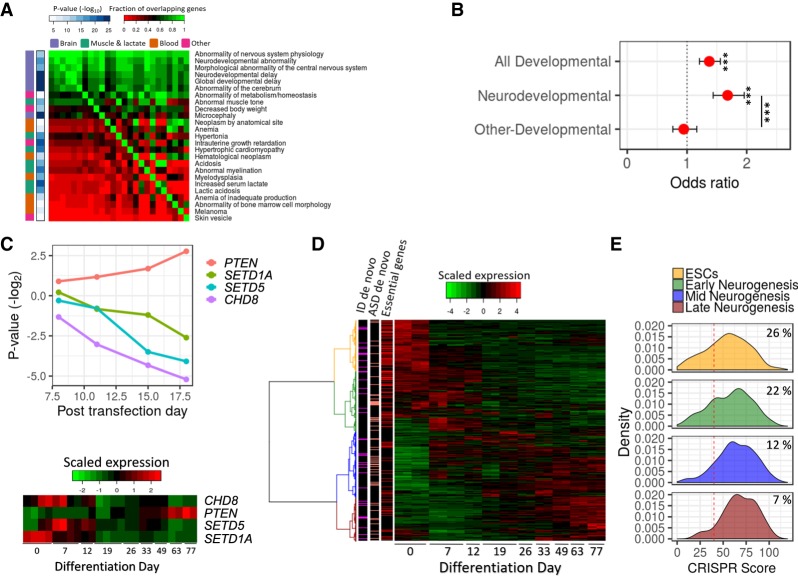
Essential genes in ESCs are associated with neurodevelopmental phenotypes. (A) Human phenotypes significantly enriched for essential genes. The phenotypes are ordered by the degree of overlap with other phenotypes. The color in the heat map corresponds to the degree of overlap in genes between phenotypes (red is low overlap; green is high overlap). The right-side bar indicates the significance level of the enrichment of each phenotype with essential genes. The left-side bar indicates the organs involved in the phenotypes. (B) Association between ESC-essential genes and risk genes for human developmental and neurodevelopmental disorders. Values are odds ratio ± 95% confidence interval. (***) Corrected P < 0.001. (C) (Top) Dynamic of gRNAs (average fold change) targeting four genes associated with neurodevelopmental disorders. (Bottom) The expression of the four genes during human in vitro corticogenesis. The colors of the heat map correspond to the normalized expression (red is high and green is low levels of expression). (D) A heat map of gene expression of risk genes for neurodevelopmental disorders during human in vitro corticogenesis. The colors of the heat map correspond to the normalized expression (red is high and green is low levels of expression). Side bars indicate ESC-essential genes (red), genes implicated in ASD by multiple de novo mutations (salmon), and genes implicated in ID by multiple de novo mutations (magenta). (E) Distribution of CRISPR scores for NDDs risk genes divided by expression patterns during human in vitro corticogenesis. The red line indicates a corrected P < 0.05. The numbers are the percentage of ESC-essential genes in each group.

