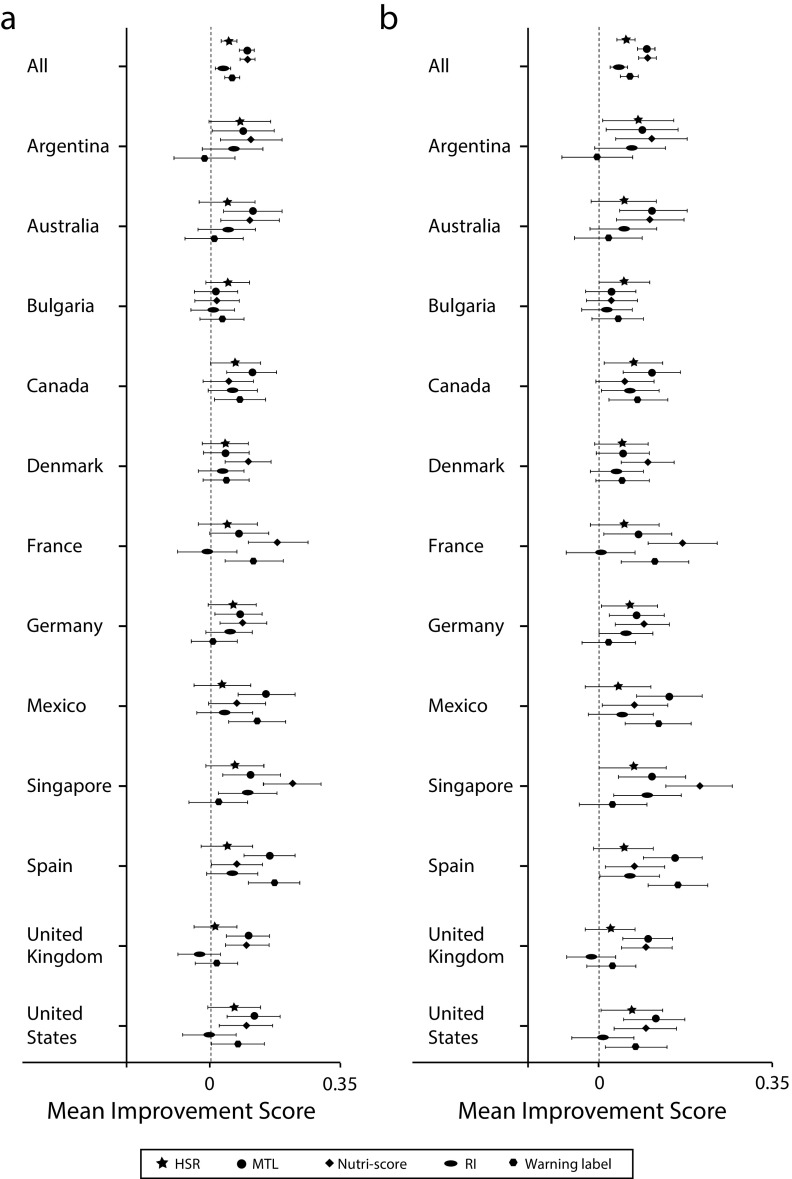
FIGURE 1—
Mean Improvement Scores According to Front-of-Package Label (FoPL) Condition for Each Country and Combined Across All Countries for (a) All Respondents and (b) Respondents Selecting Intermediate and Unhealthy Foods at Baseline: April–July 2018
Note. HSR = Health Star Rating; MTL = Multiple Traffic Lights; RI = Reference Intake. The x-axis scale represents change scores ranging from −2 to +2, with 0 representing no change and a positive value representing change toward the healthier option(s) after the addition of an FoPL. “Whiskers” indicate 95% confidence intervals. The 12 study countries were Argentina, Australia, Bulgaria, Canada, Denmark, France, Germany, Mexico, Singapore, Spain, the United Kingdom, and the United States.

