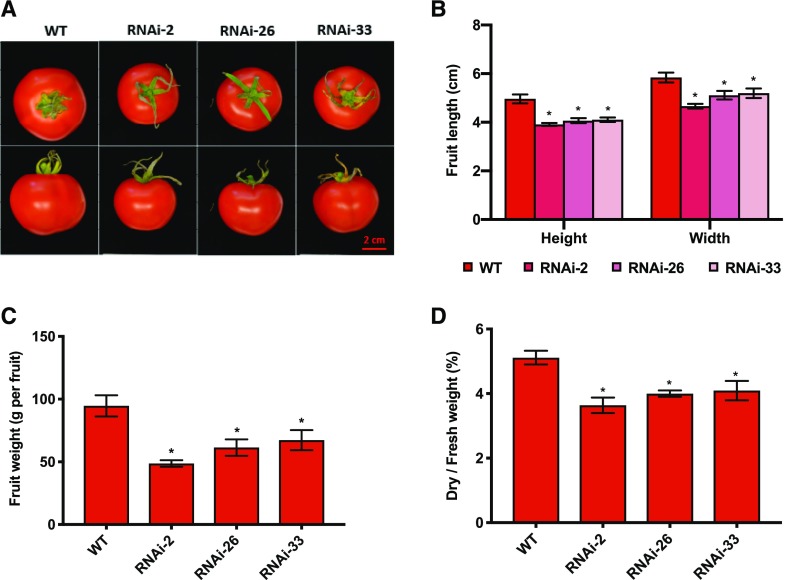
Figure 2.
Phenotypic analysis of fully ripened tomato fruits (65 DAF) of NTRC-RNAi lines 2, 26, and 33 compared to the wild type (WT). A, Visible phenotype of ripe fruits. Scale bar = 2 cm. B, Fruit length and width. C, Fruit fresh weight. D, Ratio of fruit dry weight to fresh weight. Results are the mean ± se from six biological replicates (each replicate contains data from one to three fruits). Statistical analysis used ANOVA with Dunnett’s test (*P < 0.05, compared to the wild type).

