Figure 10.
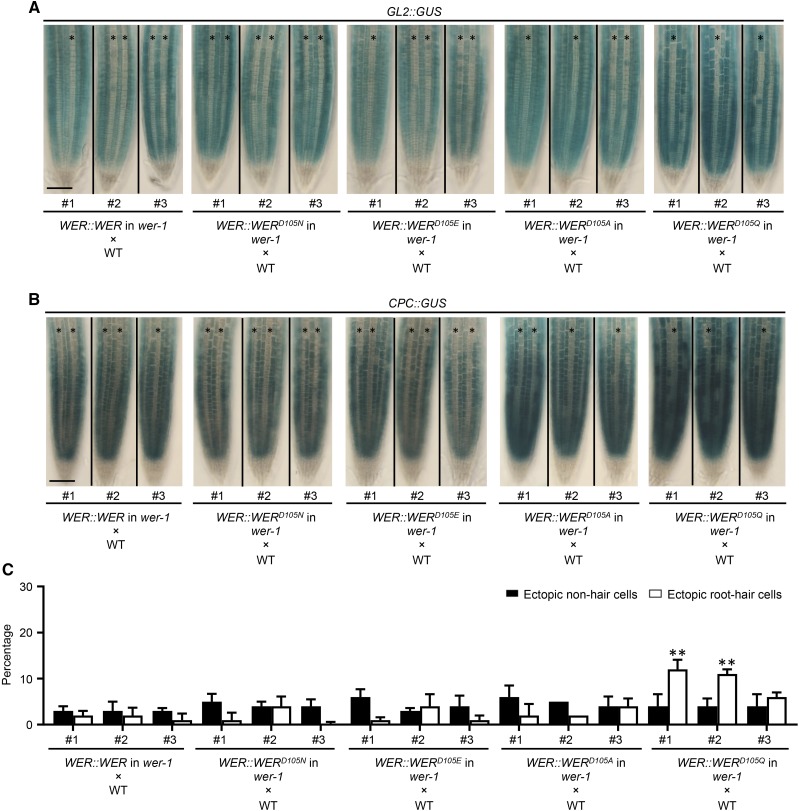
Functional comparison between WER and WER variants. A, Expression of the GL2::GUS transcriptional reporter in the F1 seedling roots from crosses between wild-type (WT) plants and wer-1 mutants bearing different WER::WER transgenes. For each transgene, representative F1 roots from crosses using three independent single-insertion lines are shown. Stars indicate H-position cell files. Bar = 50 μm. B, Expression of the CPC::GUS transcriptional reporter in the F1 seedling roots from crosses between wild-type plants and wer-1 mutants bearing different WER::WER transgenes. For each transgene, representative F1 roots from crosses using three independent single-insertion lines are shown. Stars indicate H-position cell files. Bar = 50 μm. C, Quantifications of root epidermis specification in the F1 seedling roots from crosses between wild-type plants and wer-1 mutants bearing different WER::WER transgenes. Error bars represent sd from three replicates. Two-way ANOVA was used to determine the differences among different transgenic lines using the #1 F1 population of the WER::WER transgene as the control. All F1 populations showing significant differences in H and/or N positions from the control are marked: **, P < 0.01.

