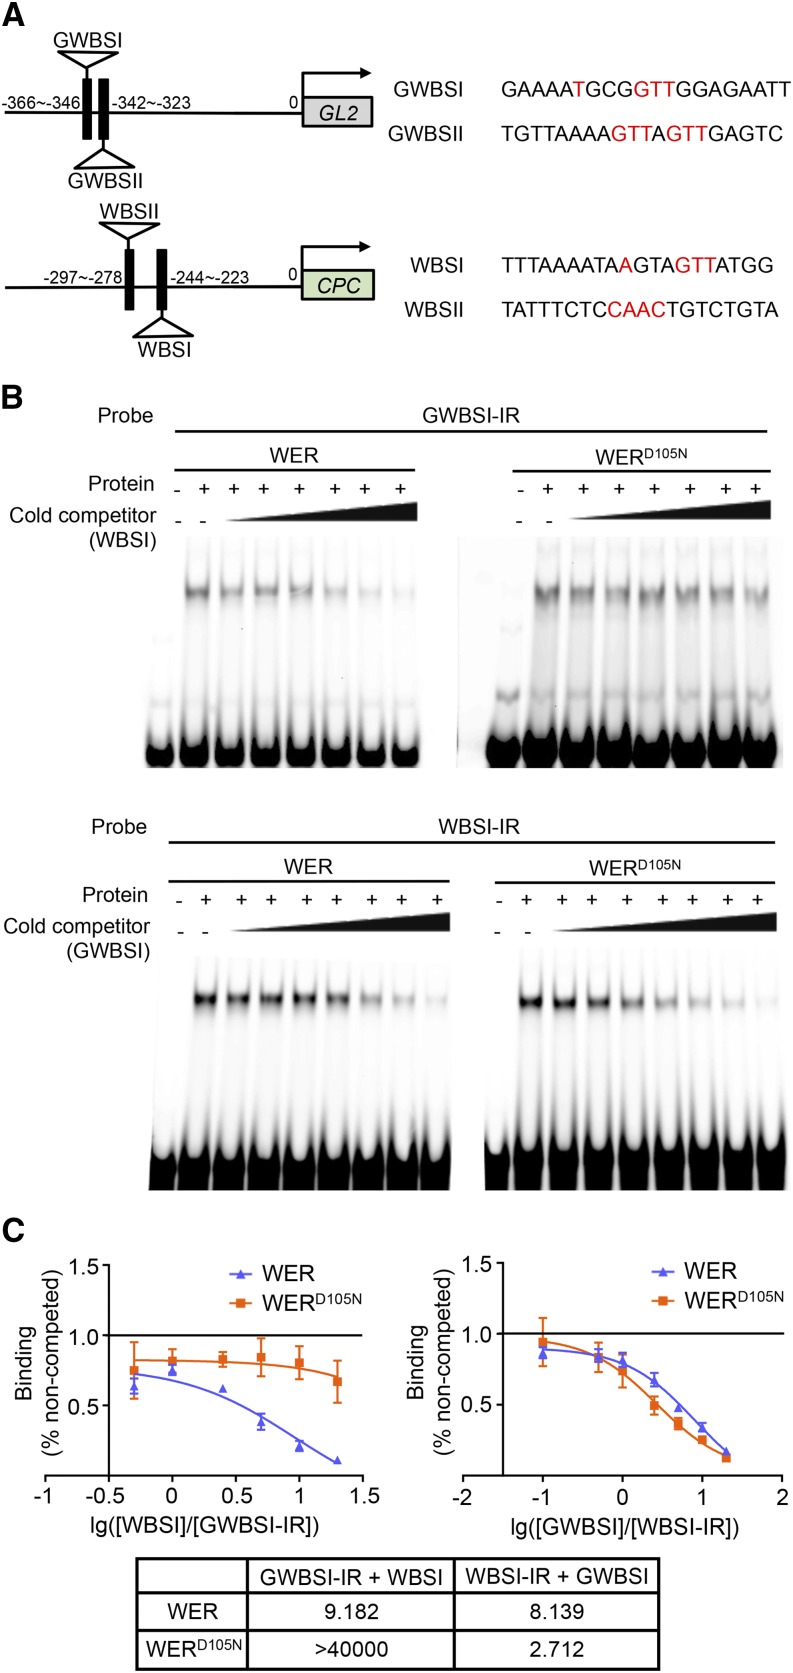
Figure 5.
The WERD105N protein exhibits altered affinities for WER-binding sites in the GL2 and CPC promoters. A, Schematic diagrams of previously identified WER-binding sites in the GL2 and CPC promoters. Numbers indicate the relative distance of each binding site from the transcription start site. On the right are the sequences of WER-binding sites. The nucleotides reported to be essential for WER recognition are colored in red. B, Competition EMSA between GWBSI and WBSI. The top section shows the result using GWBSI as the hot probe (labeled with infrared dye) and WBSI as the cold competitor. The concentrations of the unlabeled competitor are 0.5×, 1×, 2.5×, 5×, 10×, and 20× compared with the labeled probe in lanes 3 to 8 of the WER and WERD105N experiments. The bottom section shows the result using WBSI as the hot probe and GWBSI as the unlabeled competitor. The concentrations of the unlabeled competitor are 0.1×, 0.5×, 1×, 2.5×, 5×, 10×, and 20× compared with the labeled probe in lanes 3 to 9 of the WER and WERD105N experiments. C, Semilog plots of the competition EMSA results shown in B. Error bars indicate sd from three replicates. The one-site competitive binding curve model was used for nonlinear regression of each competition experiment. The calculated half-maximal inhibitory concentration (IC50) values (cold competitor/hot probe molar ratio) are listed in the table at bottom.

