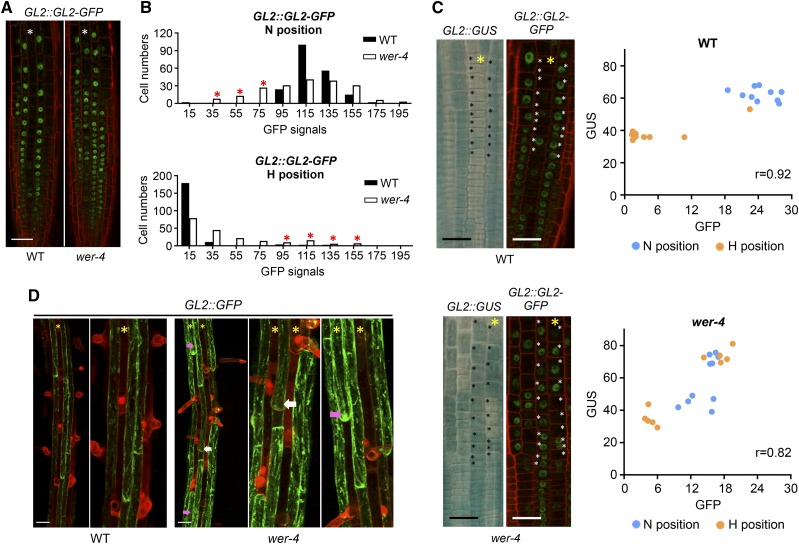
Figure 7.
Ectopic cell fates in the wer-4 mutant are associated with abnormal GL2 protein accumulation. A, Accumulation of GL2-GFP fusion protein in the root epidermis of wild-type (WT) and wer-4 seedlings carrying the GL2::GL2-GFP reporter. Red color indicates propidium iodide and green color indicates GFP. Stars indicate H-position cell files. Bar = 50 μm. B, Histograms of quantified GL2::GL2-GFP signals in wild-type and wer-4 roots (n = 200). Ten cells from H and N positions in each root were measured, and 20 roots were used for each genotype. Red stars in the N-position graph indicate groups of wer-4 N-position cells with GFP signals lower than wild-type N-position cells. Red stars in the H-position graph indicate groups of wer-4 H-position cells with GFP signals comparable to or higher than wild-type N-position cells. C, Expression of GL2::GUS and GL2::GL2-GFP reporters in a single root of the wild type and wer-4. The yellow stars indicate H-position cell files. The scatterplots at right show the GFP and GUS signal levels of cells marked with black/white stars in the wild-type and wer-4 images. r represents the Pearson correlation coefficient determined with all data points from both H and N positions from each plot. Bars = 25 μm. D, Expression of GL2::GFP in the differentiation zone (where root hairs are visible) of wild-type and wer-4 seedling roots. Stars indicate H-position cell files. For both wild-type and wer-4 images, particular regions are zoomed in on at right. White arrows point to ectopic root-hair cells in N-cell positions, and pink arrows point to ectopic nonhair cells in H-cell positions in wer-4. Bars = 50 μm.

