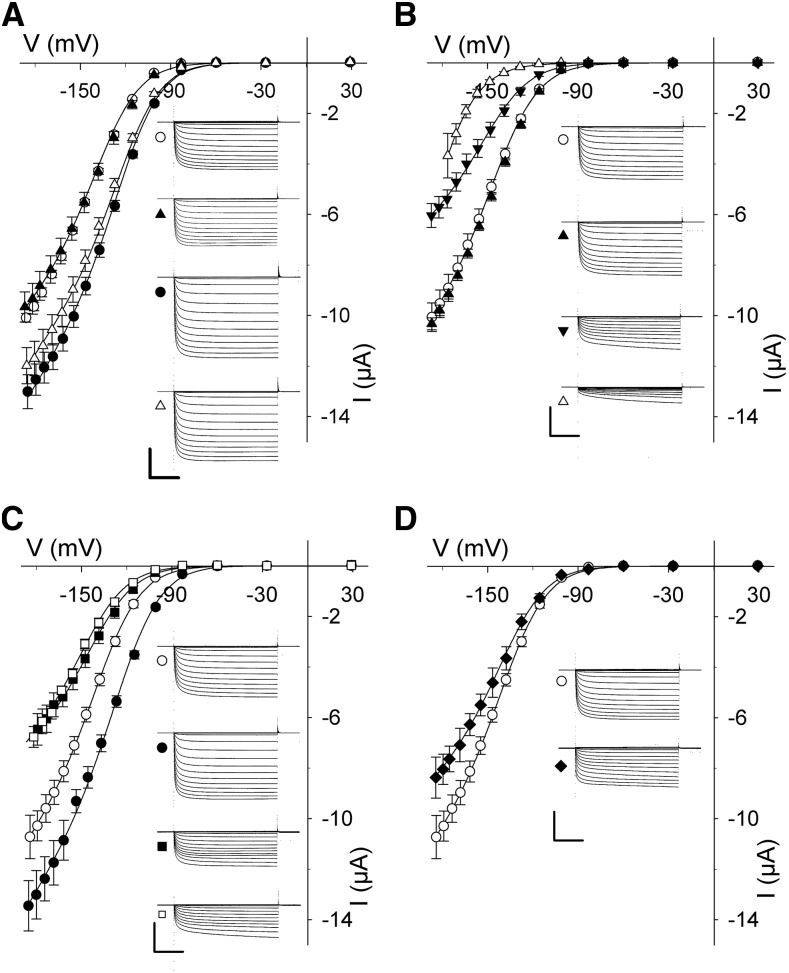
Figure 5.
SNAP33 coordinates with its cognate SNAREs in regulating K+ channel activity. Mean steady-state voltage curves recorded under voltage clamp from oocytes coexpressing the KAT1 channel alone and with combinations of the cognate SNAREs SYP121, VAMP721, and SNAP33. Data in every case are measurements from at least five independent experiments and are fitted jointly by the nonlinear least-squares method to the Boltzmann function of Equation 1. Representative current traces cross-referenced by symbol are included for each set of curves, as are data for KAT1 alone, for reference. Representative immunoblot analyses and fitting results are included in Supplemental Figure S5. Water-injected controls yielded currents of <300 nA at all voltages and are omitted for clarity. Scales represent 1 s (horizontal), 6 μA (vertical). A, KAT1 alone (○), and coexpressed with SNAP33 (▲), SYP121 (●), and SNAP33 and SYP121 (△). B, KAT1 alone (○), and coexpressed with SNAP33 (▲), VAMP721 (▼), and SNAP33 and VAMP721 (△). C, KAT1 alone (○), and coexpressed with SYP121 (●), VAMP721 (▪), and SYP121 and VAMP721 (□). D, KAT1 alone (○), and coexpressed with SNAP33, VAMP721, and SYP121 (♦).

