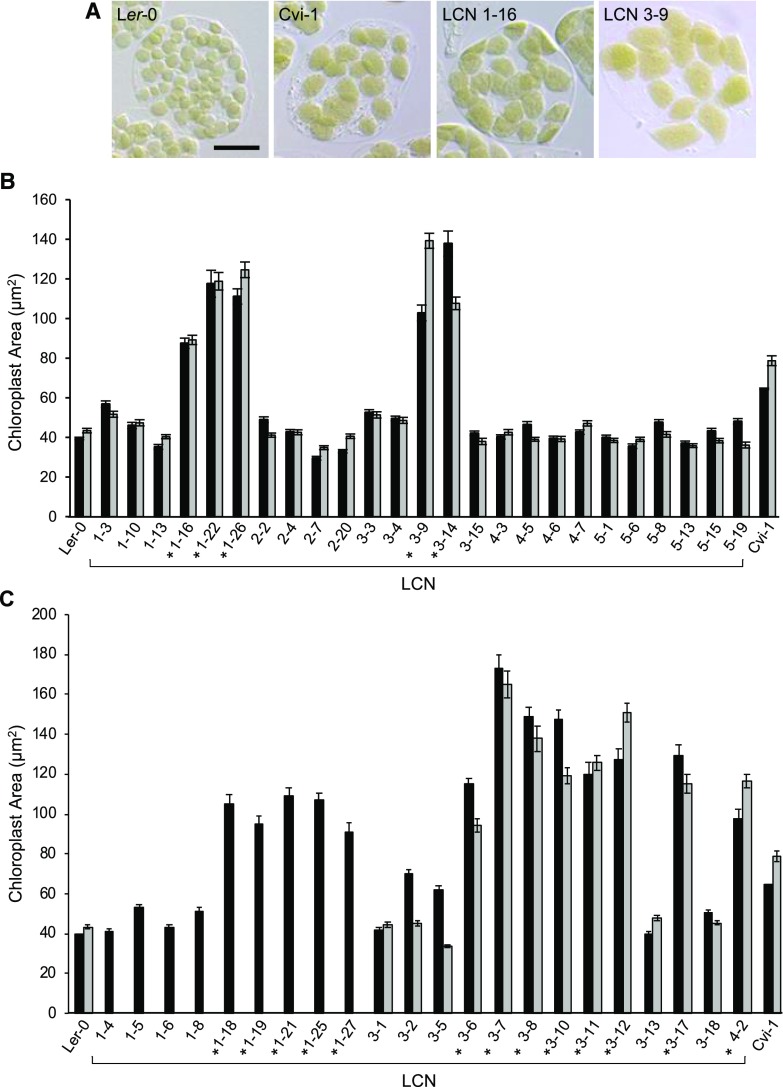
Figure 2.
Chloroplast sizes in the Ler-0 × Cvi-1 NIL population. Data are shown for the Ler-0 and Cvi-1 parent accessions and individual Ler-0 × Cvi-1 NIL (LCN) lines within the NIL population (Keurentjes et al., 2007). A, Images showing chloroplasts in mesophyll cells of Ler-0 and Cvi-1, and in LCN 1-16 and LCN 3-9 as examples of NILs with large-chloroplast phenotypes. Scale bar = 20 µm. B, Core set of 25 NILs containing Cvi-1 introgressions into the Ler-0 genome across all five chromosomes. C, An additional set of NILs containing Cvi-1 introgressions in chromosomes 1, 3, and/or 4 (see Supplemental Fig. S2). Asterisks in B and C indicate NILs with introgressions near the bottom of chromosome 3. Black and gray bars represent measurements from two independently grown sets of plants. Some NILs shown in C were only grown and scored once. Error bars indicate the SE. Sample sizes are described in the “Experimental Design” and “Sampling and Microscopy” sections of “Materials and Methods.” The same data for the Ler-0 and Cvi-1 parent accessions are repeated in B and C.

