Figure 4.
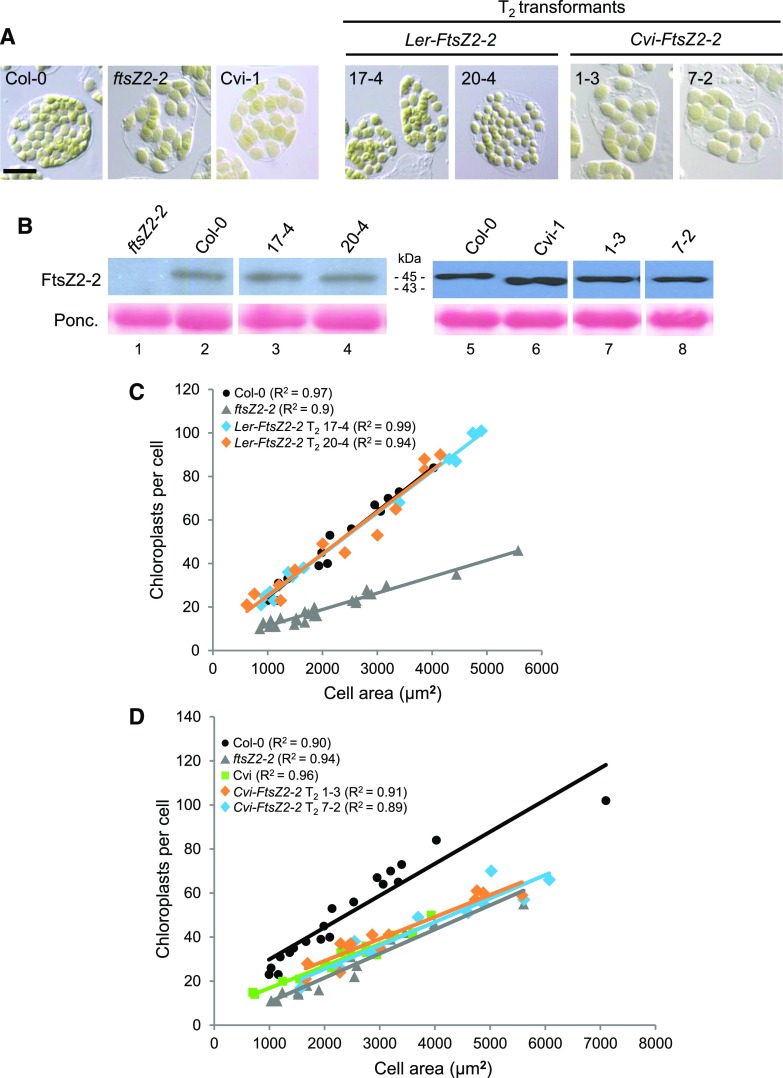
Test for complementation of the Col-0 ftsZ2-2 chloroplast-size phenotype by the Ler-FtsZ2-2 and Cvi-FtsZ2-2 transgenes. Analysis was performed on transgenic plants that accumulated FtsZ2-2 protein at levels similar to those in wild-type Col-0 or Cvi-1. A, Images of mesophyll cells showing chloroplasts in Col-0, the Col-0 ftsZ2-2 null mutant, and Cvi-1 (left images), and representative independent T2 ftsZ2-2 mutants transformed with the Ler-FtsZ2-2 or Cvi-FtsZ2-2 transgene (right images). Scale bar = 20 µm. B, Immunoblot analysis of FtsZ2-2 in leaf extracts from the genotypes shown in A. Lanes 1–4 and 5–8 were from two separate blots. Ponceau S staining of Rubisco (Ponc.) served as a loading control. C and D, Graphs of chloroplast number versus mesophyll cell size for the genotypes shown in A. Best-fit lines are drawn. R2 values for each line are indicated in parentheses. Overlapping lines indicate similar chloroplast-size phenotypes (Pyke and Leech, 1992). Data for the indicated T2 transgenic plants expressing the Ler-FtsZ2-2 and Cvi-FtsZ2-2 transgenes are shown in C and D, respectively.

