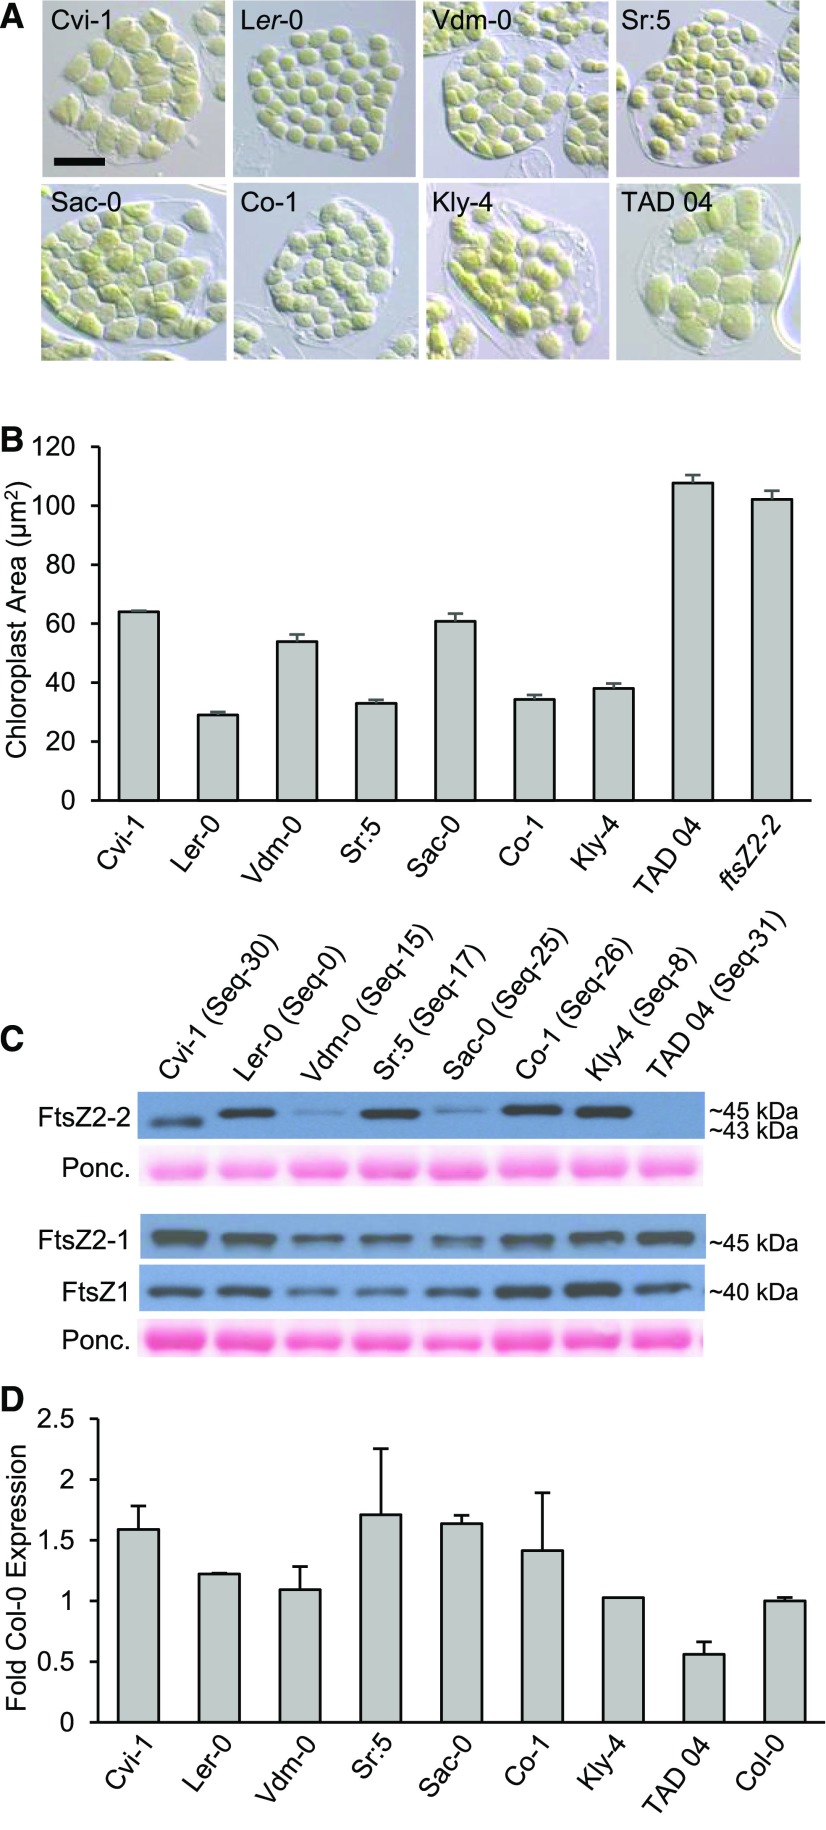
Figure 7.
Chloroplast sizes, FtsZ protein levels, and FtsZ2-2 transcript levels in representative accessions from different polymorphic groups. Protein sequence variant (Seq) numbers are specified in C and the sequences are shown in Fig. 6 and Supplemental Dataset S1. A, Images of mesophyll cells showing chloroplasts in Cvi-1, Ler-0, and accessions from different polymorphic groups. Scale bar = 20 µm. B, Chloroplast areas in the indicated accessions and the Col-0 ftsZ2-2 null mutant. Error bars represent the se. Sample sizes are described in the “Experimental Design” and “Sampling and Microscopy” sections of “Materials and Methods.” C, Immunoblot analysis of FtsZ proteins in leaf extracts from the accessions shown in A. FtsZ2-1 and FtsZ1-1 were probed together on the same blot. Ponceau S staining of Rubisco (Ponc.) served as a loading control. Figs. 3B and 4B show that FtsZ2-2 protein is undetectable in ftsZ2-2. D, FtsZ2-2 transcript levels in the accessions shown in C relative to those in Col-0 determined by RT-qPCR. Error bars represent the se except for the accession Kly-4. Sample sizes are described in the “RT-qPCR” section of “Materials and Methods.”

