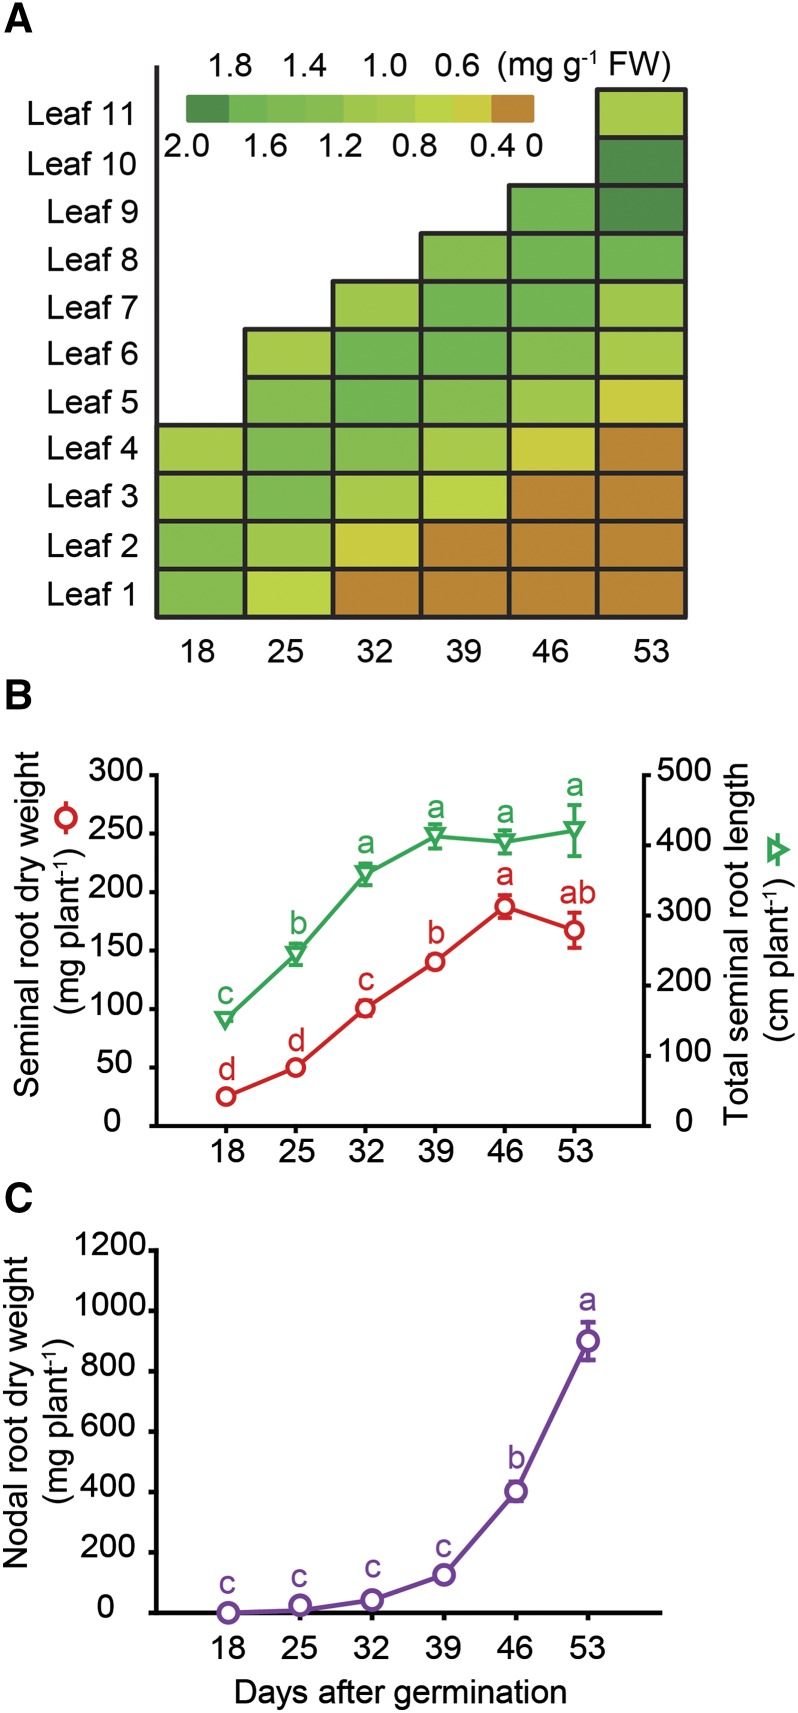
Figure 1.
Development of leaf chlorosis and growth of seminal and nodal roots with progressing plant age. A, Color-coded heat map of chlorophyll concentrations in individual leaves (numbers 1–11) of the main tiller. B, Dry mass and total length of the seminal root system. C, Dry mass of the nodal root system. Hydroponically grown barley plants were harvested weekly from 18 to 53 d after germination (dag). Symbols represent means ± se. Different letters indicate significant differences among means according to Tukey’s test at P < 0.05 (n = 5 independent biological replicates).

