Figure 7.
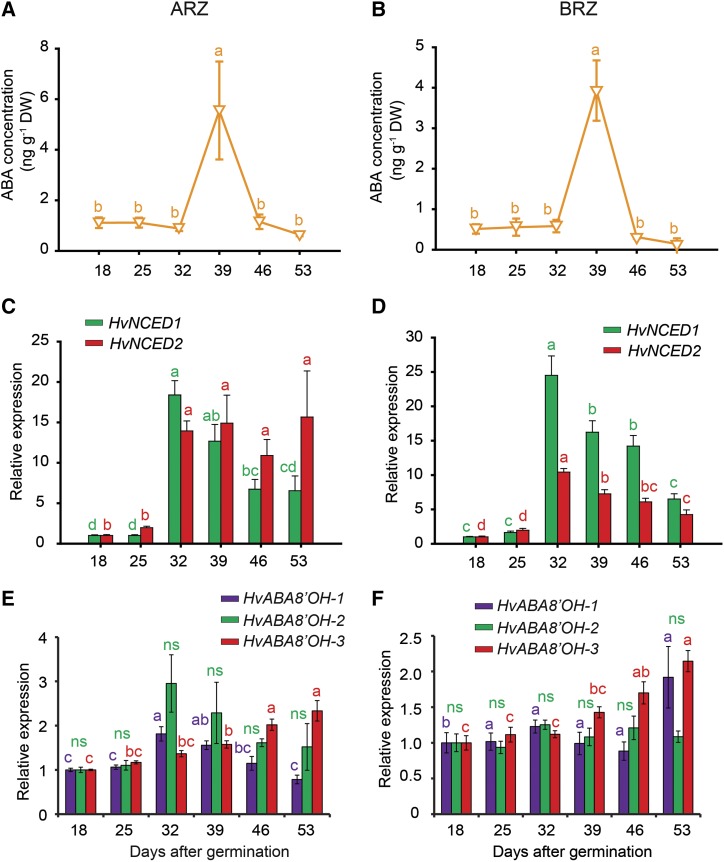
Hormone profile and relative expression of genes involved in ABA metabolism with progressing plant age. Concentrations of ABA (A and B); transcript levels of barley 9-CIS-EPOXYCAROTENOID DIOXYGENASE (HvNCED1 and HvNCED2; C and D), and of ABSCISIC ACID 8′-HYDROXYLASE (HvABA8′OH-1, HvABA8′OH-2, and HvABA8′OH-3; E and F) in the apical (ARZ) and basal root zone (BRZ) of plants sampled weekly from 18 to 53 d after germination (dag). Relative expression values of target genes were normalized to transcript levels of UBIQUITIN C (AY220735.1), and values at 18 dag were set to 1. DW, Dry weight. Triangles and bars represent means ± se. ns, not significant. Different letters indicate significant differences among means according to Tukey’s test at P < 0.05 (n = 5 independent biological replicates).

